Defend why this portfolio,
not that one, in 10 minutes.
See your portfolio by Transform, Maintain, Grow. Map to OKRs, pull budget actuals from Value Tracker, check demand vs capacity from Resource Management, run what-if optimization across workspace candidates, and keep every decision auditable with versioning.
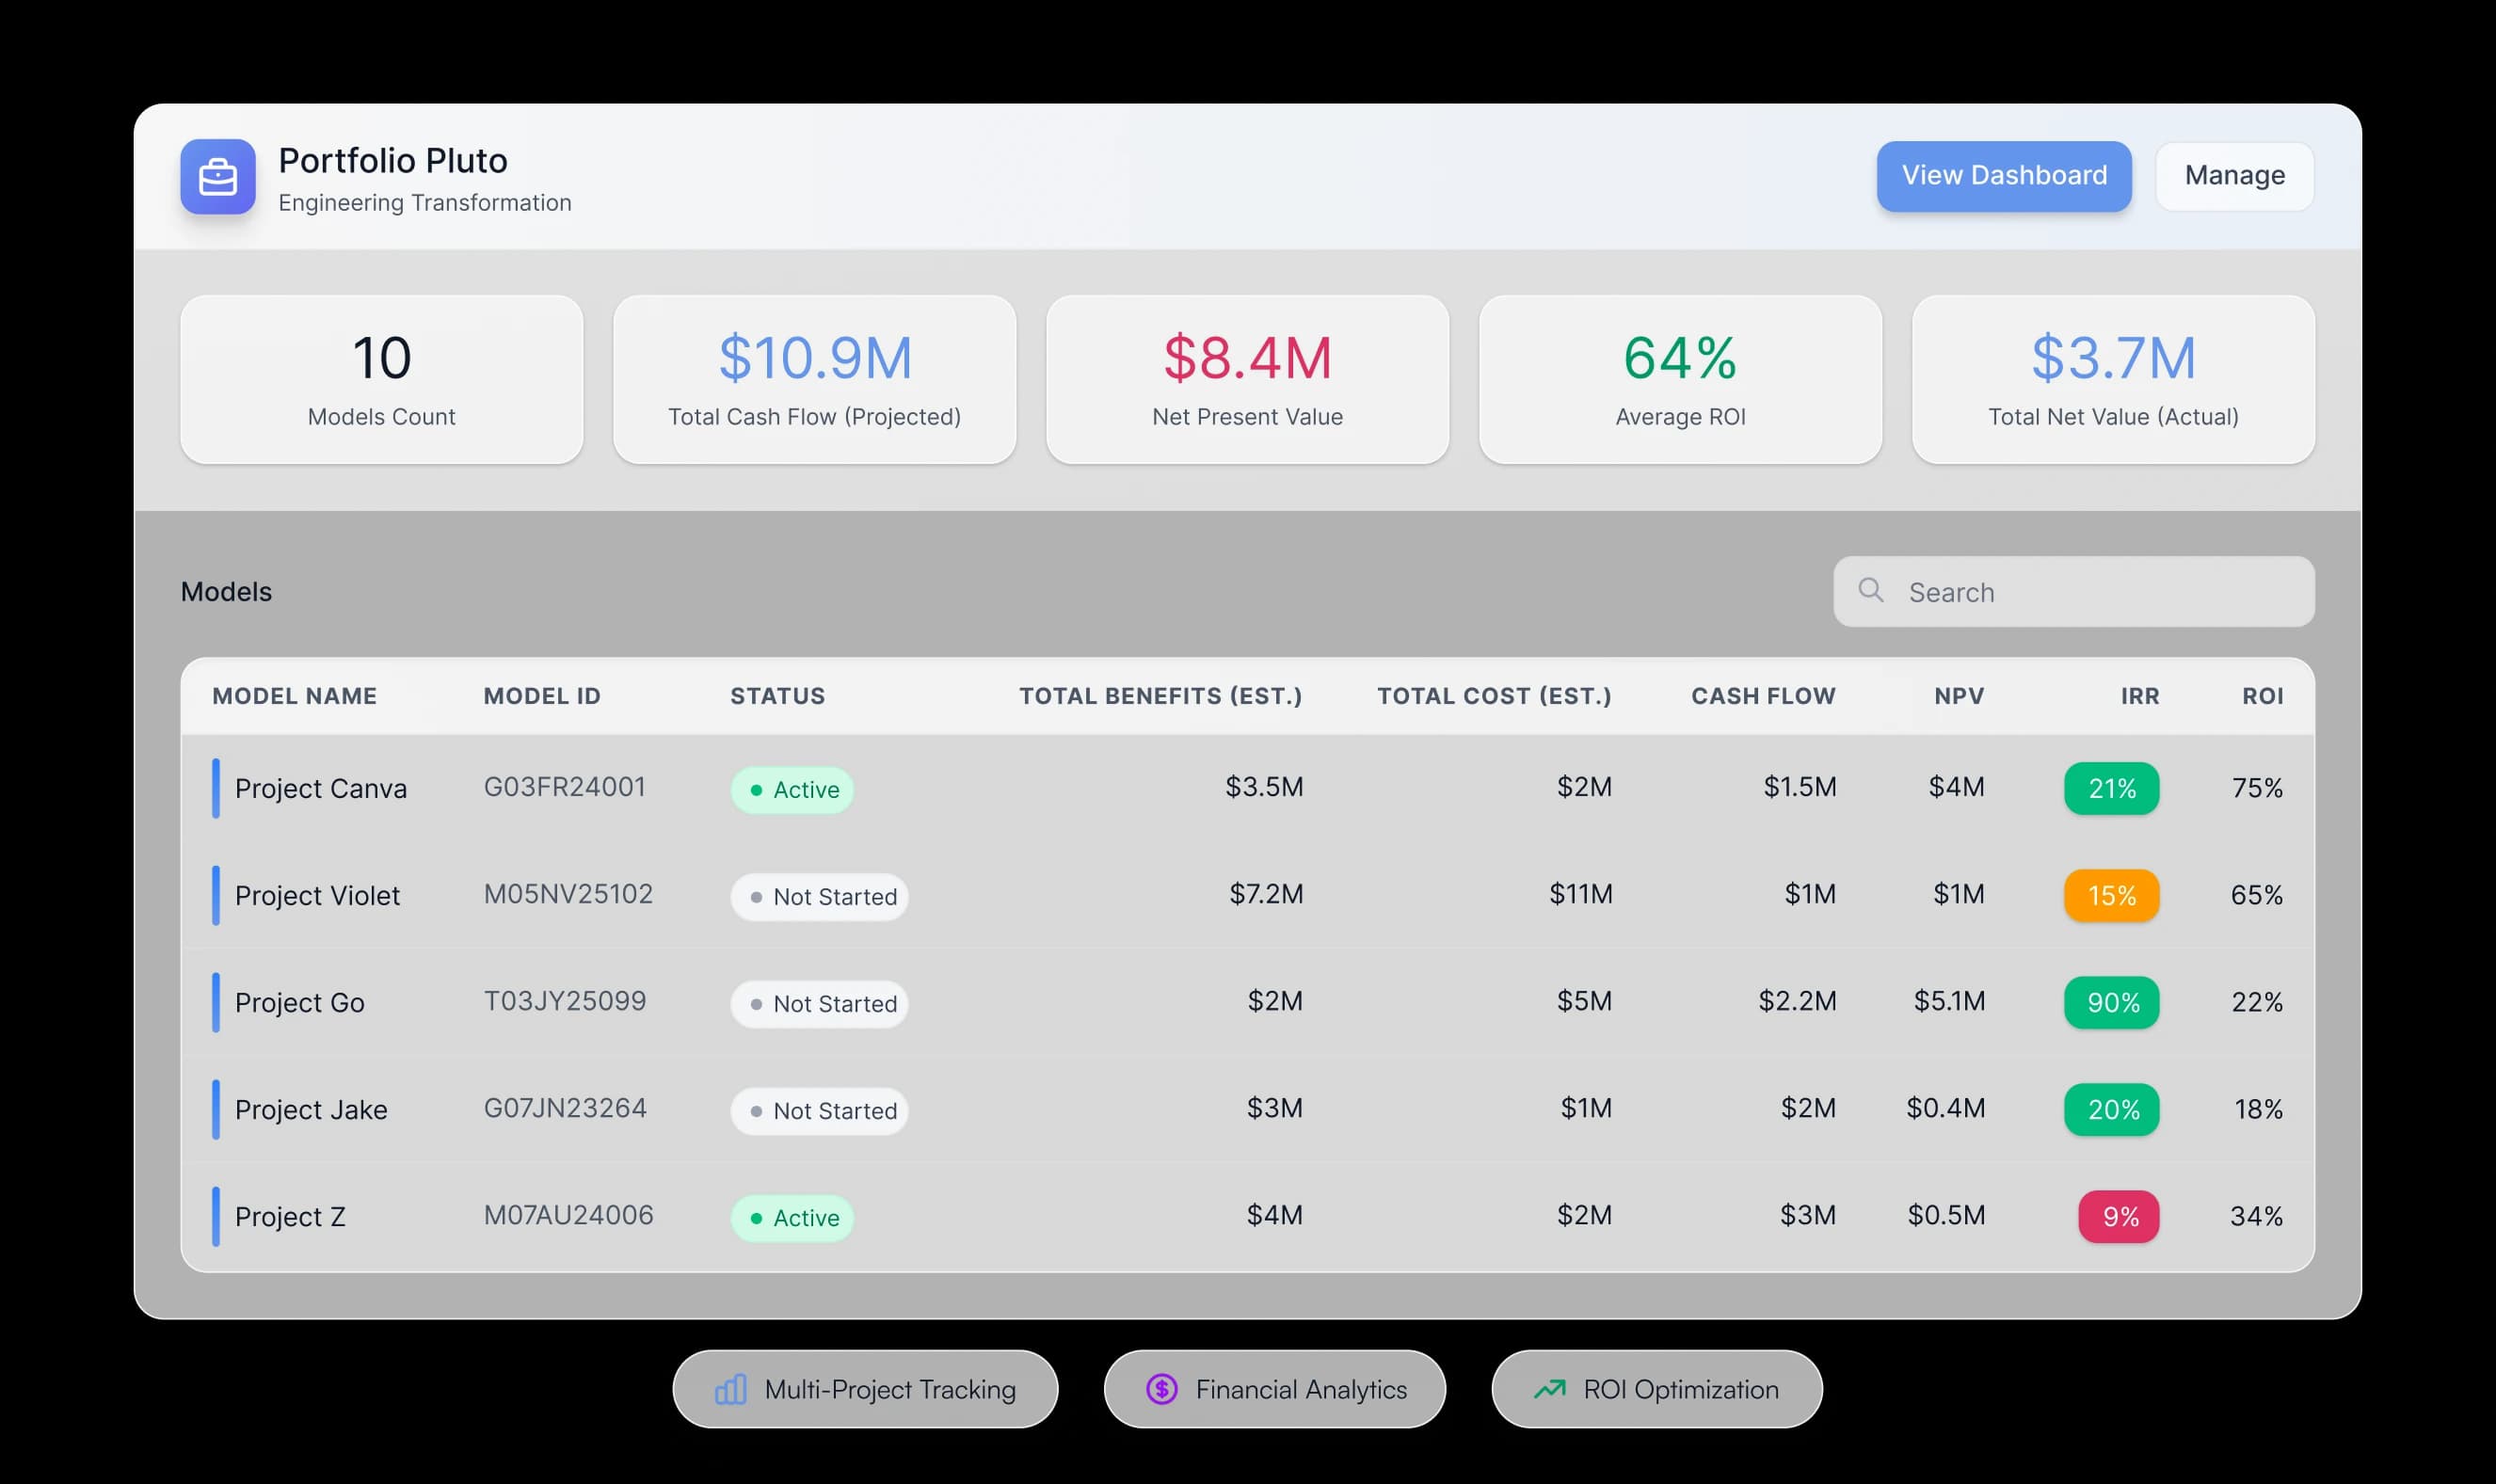
Stop hunting in spreadsheets. See where value sits by Transform, Maintain, Grow.
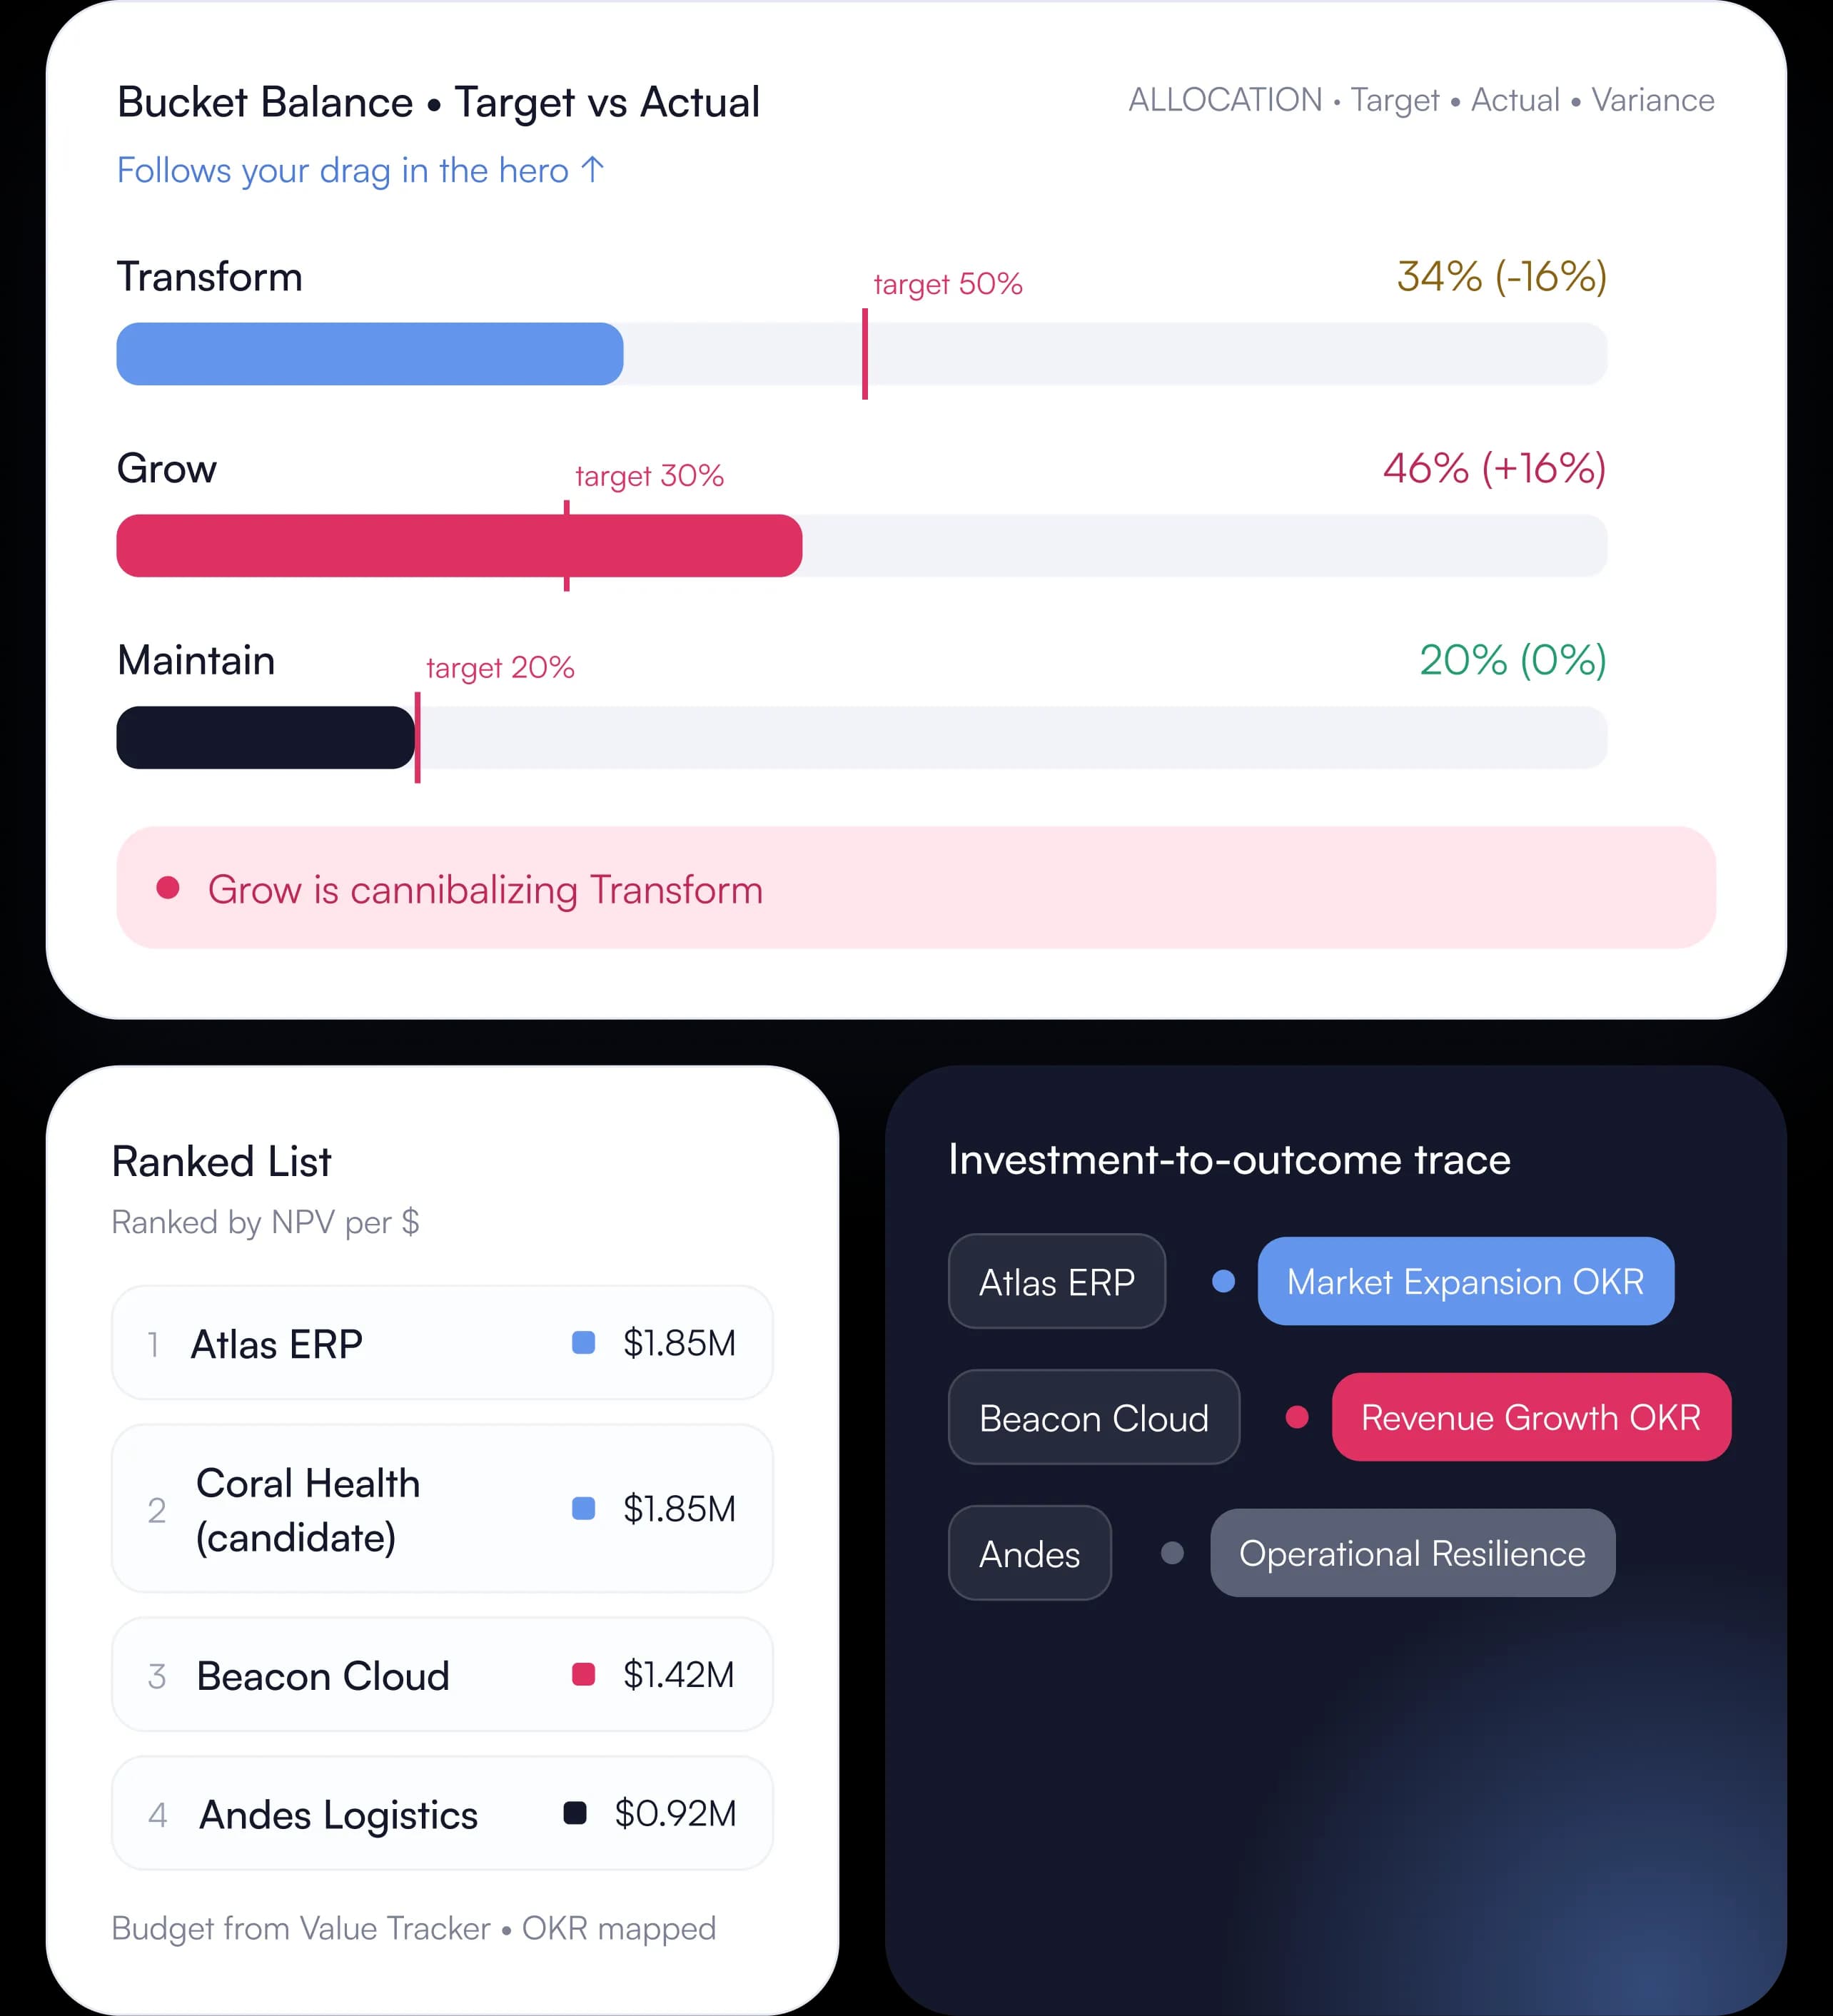
Dashboard shows portfolio by strategic bucket Transform / Maintain / Grow mapped to OKRs. For example, Transform → Market Expansion OKR, Grow → Revenue Growth OKR, Maintain → Operational Resilience. You finally see bucket balance, not just a list.
Investment-to-outcome: Tie every capital commitment to the OKR it was funded to produce. No more Transform bucket filled with Maintain work.
Budget details pulled directly from Value Tracker for each project: estimate, budget, actuals, and EAC side by side. No re-keying. Portfolio = sum of business cases.
Portfolio List • Ranked by NPV per $ • Strategic Bucket
- 1$1.85M NPVAtlas ERPTransform
OKR: Market Expansion • Budget from VT
$2.4M / $2.1M actuals / $2.45M EAC
- 2$1.42MBeacon CloudGrow
OKR: Revenue Growth • Budget from VT
$1.3M / $0.9M actuals
- 3$0.92MAndes LogisticsMaintain
OKR: Operational Resilience • Budget from VT
$0.8M / $0.75M actuals
Ranking is easy. Defending bucket balance is hard.
Prioritize within and across buckets Transform / Maintain / Grow. Tie every capital commitment to the OKR it was funded to produce. You see when Grow is cannibalizing Transform, or Maintain is quietly taking 50%.
Bucket allocation: Transform 45% / Grow 35% / Maintain 20% with target vs actual. Target Transform 50% → actual 45% flagged.
NPV per $ ranking uses budget from Value Tracker, so ranking uses the same numbers finance already approved.
Investment-to-outcome trace: Atlas ERP [Transform] → Market Expansion OKR, Beacon Cloud [Grow] → Revenue Growth OKR, Andes [Maintain] → Operational Resilience.
Resource View • Linked to Resource Management
Live from RMDEMAND (solid) VS CAPACITY (dashed) • Engineering 1,200h cap
Q2: -400h freed → Q4 +400h
Engineering
400 hrs freed
Q2 → Q4 shift
BUDGET vs CAPACITY
$11.2M actuals
From Value Tracker
Skills: Engineering • Product • Data • Demand linked to RM module
Open in Resource Management →
Know whether you can actually deliver it by skill.
Resource view linked to the Resource Management module: demand vs capacity by engineering, product, data skills. Planned vs actual effort graphic, timeline shifts frees 400 hrs earlier adds later. Budget vs capacity trade-off visible because budget from Value Tracker.
Demand vs capacity by skill: engineering, product, data. See where Transform projects compete for same senior engineers.
Planned vs actual effort; a timeline shift frees 400 hrs in Q2, adds 400 hrs in Q4. No surprise at execution.
Budget + capacity together: Budget from Value Tracker, capacity from Resource Management in one view. Trade budget for capacity without leaving portfolio.
Outcome: Stop finding capacity issues at execution. Check feasibility before you prioritize.
Sandbox until you Apply. Budget from Value Tracker, capacity from Resource Management.
Mode 1 Portfolio Only / Mode 2 Portfolio + Workspace candidates (Coral Health etc). Optimizer ranks by NPV per $ with budget from Value Tracker and capacity from Resource Management. Impact +$1.6M NPV −400 hrs. On Apply: Portfolio Overview becomes v2, removed becomes Unfunded / Out Reason Optimization.
Two modes: Portfolio Only (re-balance existing) vs Portfolio + Workspace (include candidates like Coral Health [Transform]).
Constraints: Budget from Value Tracker, capacity from Resource Management, bucket targets (Transform 50%). Optimizer respects all three.
What-if without risk: Sandbox until Apply. Save as Scenario, compare v1 vs v2, then Apply to become Portfolio Overview v2.
Optimization Sandbox
Sandbox · not appliedNPV Impact
±$0.0M
$11.2M → $11.2M
Capacity
±0 hrs Eng
Bucket shift
Transform 45%→45%
Budget from VT
±$0.0M variance
$15.0M of $15.3M
Engineering over capacity by 260h
Transform 45%, below 50% target
Projects to Add • Included
None
Projects to Remove • Out Reason
None
On Apply: Portfolio Overview becomes v2 • Removed → Unfunded • Decision logged
No silent change. Every decision logged, versioned, and appealable.
Portfolio Overview v2 saved, v1 archived, revert available. Decision Log + Audit Trail entry, Notifications Owner/Sponsor bell+email, 5-day appeal window before funding released, Board approval if >$500k. Budget traceability to Value Tracker, resource traceability to Resource Management.
Versioning: Portfolio Overview v2 Optimized, v1 archived with revert. No silent overwrite.
Decision Log: Optimization run logged, Approver Portfolio Board, rationale NPV per $ + bucket balance + capacity.
Notifications + appeal: Beacon Cloud team marked Unfunded, Out Reason Optimization, Appeal by Oct 31, bell + email, 5-day window before funding released.
Traceability: Budget verified from Value Tracker (estimate/budget/actuals/EAC), capacity verified from Resource Management (demand vs capacity by skill). Board approval gate if >$500k impact.
Governance • Decision Log
v2 Approved- 1
Version History
v2 Optimized
Current • Atlas ERP replaces Beacon Cloud • +$1.6M NPV
v1 Archived
RevertRevert available • 2026-09-18
- 2
Decision Log + Audit Trail
Optimization run logged
Approver: Portfolio Board • Reason: NPV per $ + bucket balance (Transform target 50%) + capacity constraint • Budget from VT verified • Resource Management demand check passed.
- 3
Notifications • Appeal Window
Beacon Cloud team → Unfunded
Out Reason: Optimization • Appeal by Oct 31 • Bell + email sent • Funding held 5 days
- 4
Board approval gate
Board approval >$500k
Approved in one meeting • Budget from VT $2.4M verified
Your portfolio KPIs update the moment actuals come in. No refresh required.
The gap between promise and delivery is visible at the portfolio level, in real time, always. This is the connected planning capability that makes Proconomics a system of record, not a reporting tool you visit once a quarter. Portfolio doesn’t just show modelled projections, it’s continuously connected to the Value Tracker layer underneath.
Model Builder
Approved models
Value Tracker
Budget
estimate / budget / actuals / EAC
Portfolio Management
Best portfolio
Transform 45% • Grow 35% • Maintain 20%
Resource Management
Capacity
demand vs capacity by skill
Strategic Alignment
100% mapped to OKRs
Budget Source
Value Tracker • estimate / budget / actuals / EAC
Capacity Source
Resource Management • demand vs capacity by skill
Connect your projects and get a live, consolidated view in minutes. No migration project. No IT dependency. Just portfolio intelligence from the models your team has already built.
Scenario, optimization, risk, and map.
Scenario analysis
Before you cut the budget or delay the launch, see exactly what it costs the portfolio.
Every major portfolio decision; a budget cut, a delayed start, a scope reduction, a new project added, changes the performance of every other initiative it’s connected to. Scenario analysis lets you model those ripple effects before you act and see the impact on NPV, IRR, cash flow, and total portfolio value in real time.
Portfolio optimization
Find the highest-value mix your budget and capacity can actually carry.
Run the optimizer across existing projects and workspace candidates. It ranks by NPV per dollar, respects Value Tracker budget, Resource Management capacity and your bucket targets, then shows exactly what to add, what to drop, and why.
Risk & exposure
See where risk is concentrated before it turns into a write-off.
Every project carries a risk level next to its NPV, IRR and ROI. Slice by sector, region or bucket to see how much of the portfolio’s value rests on high-risk bets, and where a single failure would hit hardest.
Map view
See the shape of the portfolio, not just the list.
Map View plots capital across Transform, Grow and Maintain and against the OKRs it funds, so over-funded and under-funded objectives stand out at a glance.
“We moved from debating priorities in slides to defending Transform / Maintain / Grow balance with real budget from Value Tracker and capacity from Resource Management. Optimization gave us +$1.6M NPV and the decision log showed why Atlas ERP replaced Beacon Cloud; the board approved v2 in one meeting.”
VP Portfolio Management, global manufacturer tracking $2.1B portfolio, 120+ projects across Transform / Maintain / Grow
120+
projects tracked by Transform / Maintain / Grow with OKR mapping
$2.1B
portfolio value, budget verified from Value Tracker actuals
45/35/20
bucket balance Transform / Grow / Maintain after optimization

See what Portfolio is delivering for finance leaders.
For the first time, I walked into a board meeting with live portfolio data instead of a slide deck built three weeks earlier. The conversation shifted from 'is this right?' to 'what do we do about it?' That's a different kind of meeting.

James Burtler
CEO, Global Infrastructure Business
The scenario analysis changed how we allocate capital mid-year. We ran four scenarios in an afternoon that would have taken two weeks in spreadsheets. We made a $4M reallocation decision the same day.

Michael Johnson
VP of Finance, Enterprise Technology Company
Projects are grouped into Transform, Maintain, and Grow; each is mapped to an OKR. Transform → Market Expansion, Grow → Revenue Growth, Maintain → Operational Resilience. You see allocation vs target, rank within and across buckets, and defend bucket balance, not just a list.
Straight from Value Tracker. Every project’s estimate, budget, actuals, and EAC are pulled in as they are, so the portfolio is the sum of its business cases and nobody re-keys a number.
Demand and capacity come live from the Resource Management module, by skill: engineering, product, and data. Shift a project’s timeline and you see hours freed in one quarter and added in another before anything is committed.
The sandbox result becomes Portfolio Overview v2 and v1 is archived with a revert. Removed projects are marked Unfunded with the out reason, owners and sponsors are notified by bell and email, a 5-day appeal window opens, and changes over $500k go to the board.
It is the practice of choosing, funding, and steering a set of projects as one investment, so capital and people go to the work that best serves strategy, instead of judging each project on its own.
Approved models from Model Builder, budget from Value Tracker, and capacity from Resource Management meet in one view. You rank by NPV per dollar, check bucket balance and capacity, run what-if optimization, and log every decision.
Portfolio KPIs update as actuals arrive, so IRR, ROI, and EAC variance are always current. Color-coded IRR and risk levels flag the projects drifting from their business case, before the quarterly review.
Yes. Filter and group by sector, region, bucket, or OKR, and compare NPV, IRR, ROI, cash flow, and risk side by side across any slice of the portfolio.
How the buckets, budget, and capacity connect
Still have questions?
Can’t find the answer you are looking for? Kindly check our complete list of FAQs
View Complete FAQsStop presenting a list. Start showing best portfolio by Transform Maintain Grow with budget from Value Tracker and capacity from Resource Management.
We’ll walk through the module against your own portfolio: buckets, OKRs, Value Tracker budget, Resource Management capacity, optimization sandbox, and governance log live.
No credit card required · SOC 2 Type II · Connects to Model Builder
Stay ahead of the curve
Subscribe to our newsletter to receive valuable insights directly in your email.
Solutions


