Build the model. Manually, or just describe it.
Model Builder turns a project description, a template, or a blank page into a complete business case: assumptions, cost of capital, cost and benefit tables, a realization schedule, and up to three scenarios, ready to view by quarter or by year.
No credit card required · First model in minutes · Built-in templates for 200+ project types
200+
ready-made templates across industries and project types
3
scenarios per model, compared side by side
3 / 5 / 10
year horizons, your choice at setup
Qtr
or annual, switch the view without rebuilding the model
You already know what’s wrong with the spreadsheet.
Five tabs named “FINAL.” A discount rate that’s different in two of them. No record of who changed the benefit ramp two weeks before the steering meeting. This is the version most business cases actually run on.
Drag to compare
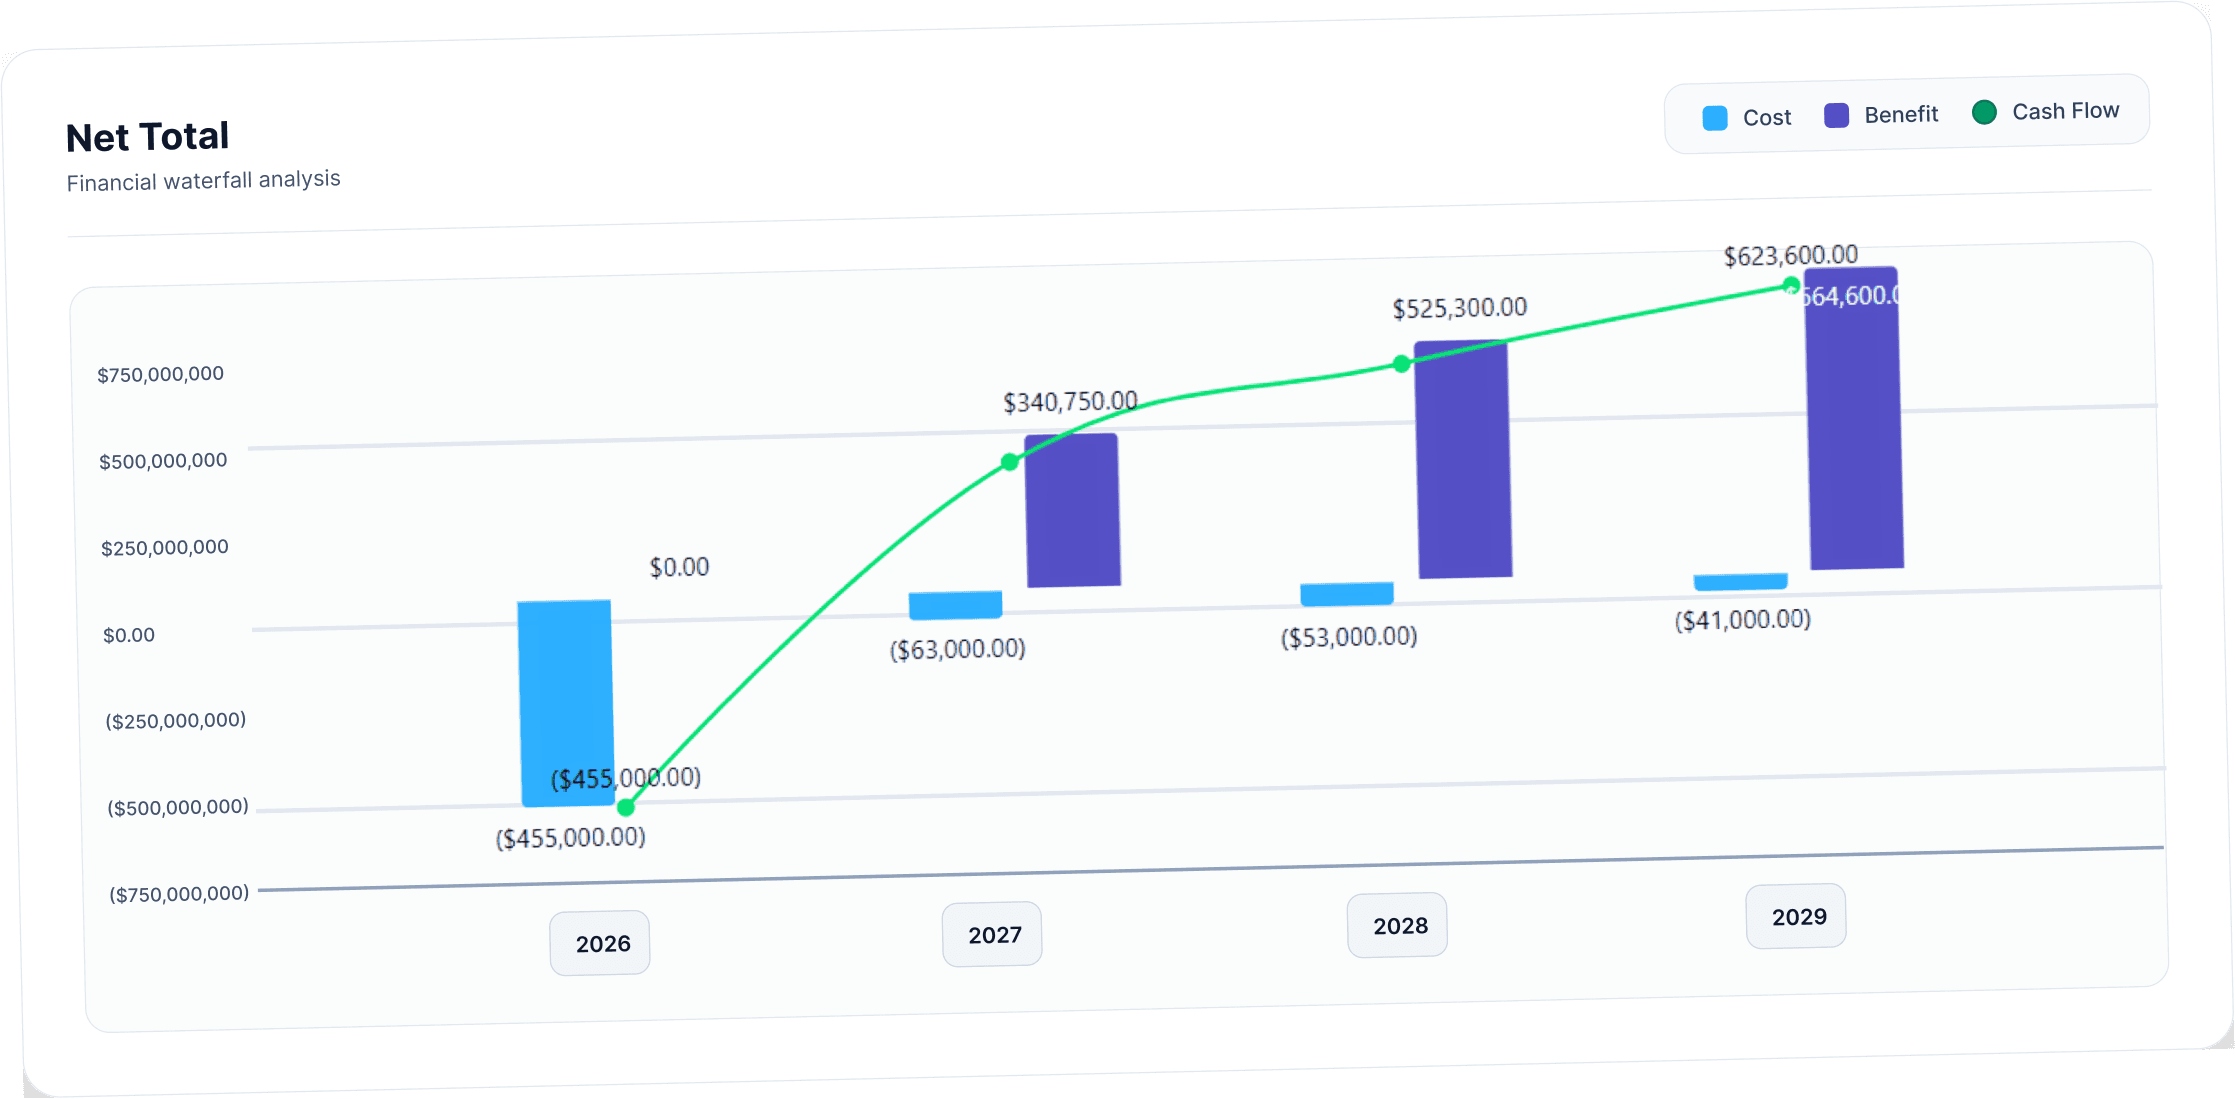
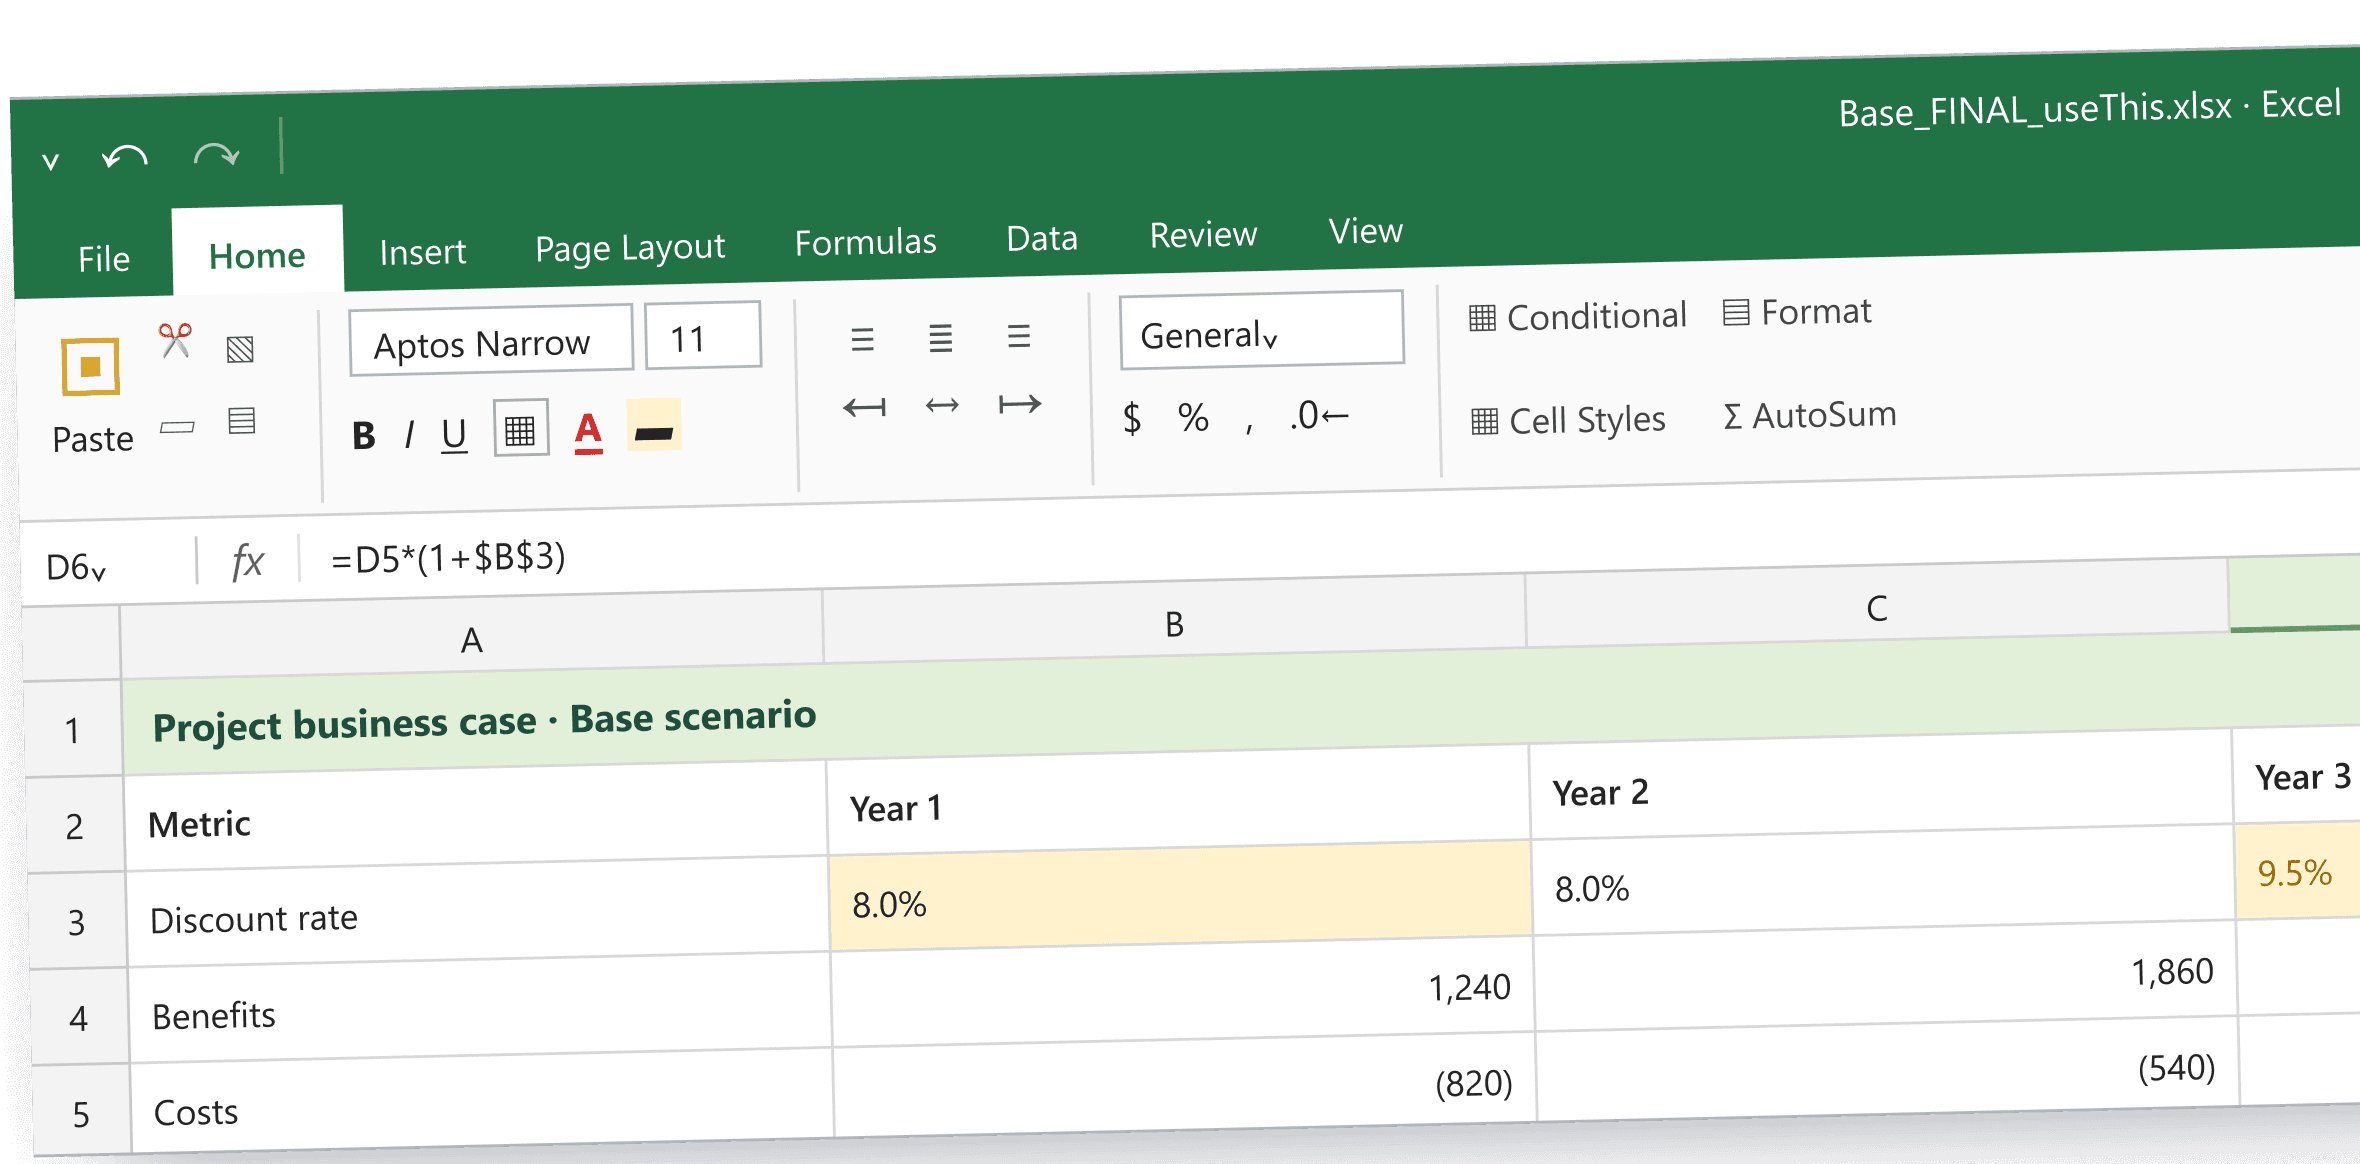
Build it yourself, or let AI draft the first pass. Same rigorous model either way.
However a model starts, it ends up in the same structure: qualitative summary, assumptions, cost and benefit tables, and a dashboard. Nothing built with AI needs to be rebuilt by hand later.
Same structure
- 01Qualitative summary
- 02Assumptions
- 03Cost table
- 04Benefit table
- 05Dashboard
Everything a business case needs, in one model
Every model is built from the same set of connected pages, so an analyst, a finance partner, and a sponsor are always looking at the same underlying numbers.
Five connected pages, every time
A qualitative summary, assumptions with cost of capital, a cost table, a benefit table, and a dashboard, all generated together, whether you start from AI, a template, or a blank page.
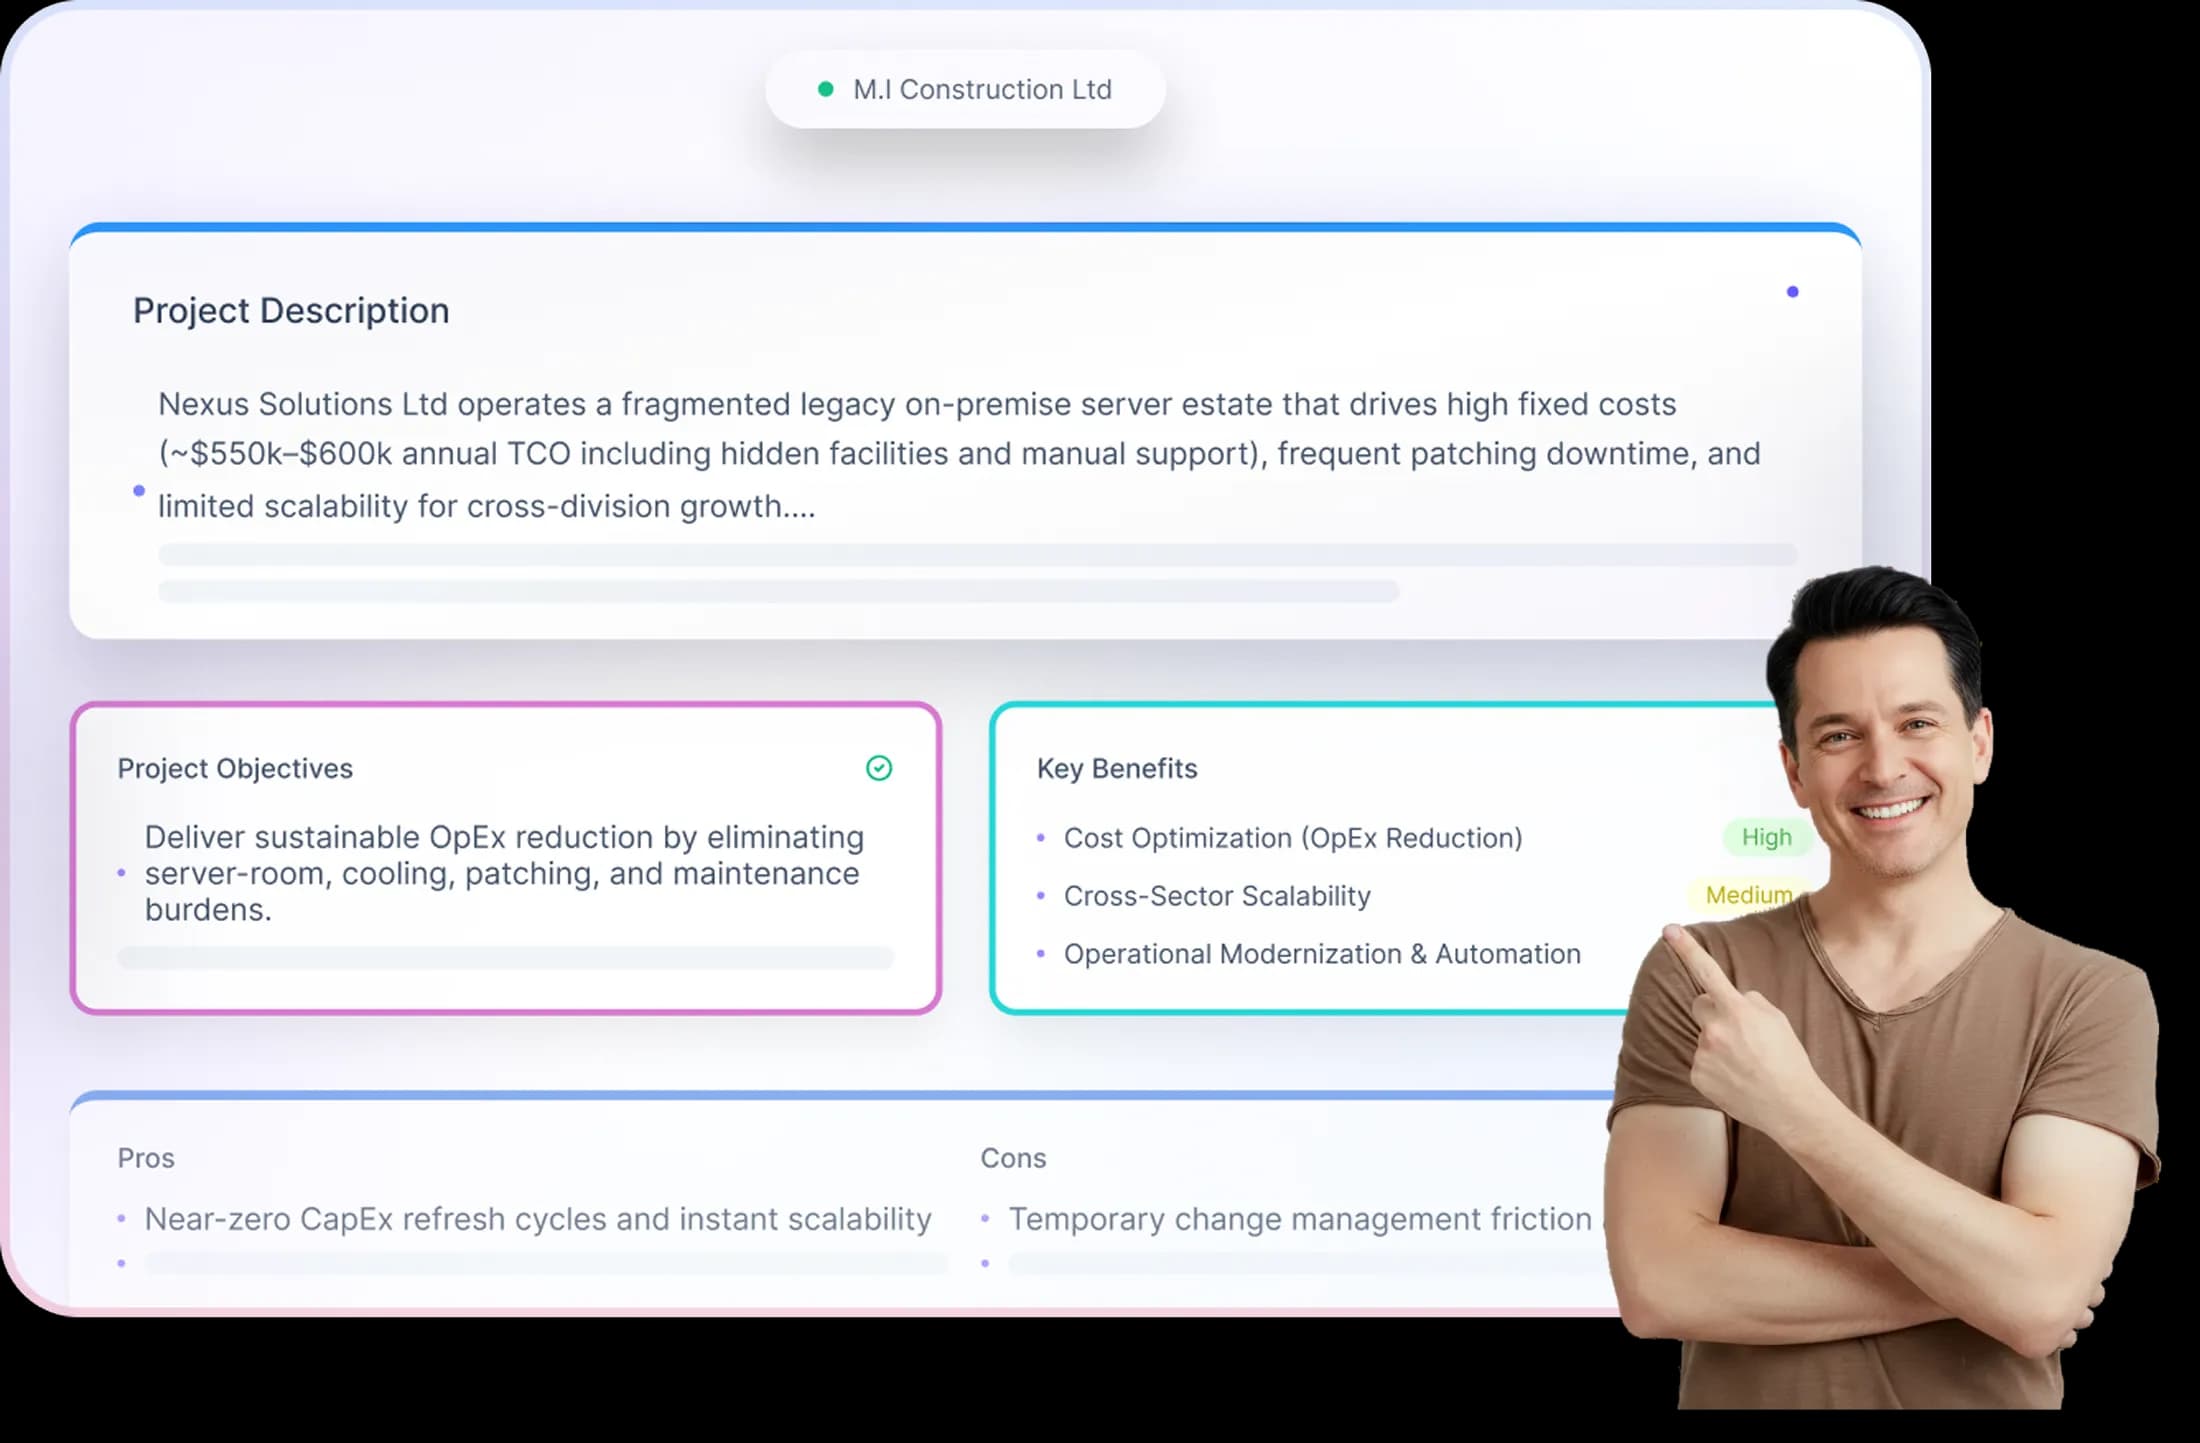
01 · Qualitative summary
A story written in plain language
Read the qualitative summary for the narrative, then the dashboard for the numbers. View them in quarters or years, whichever matches how you think about the project.
02 · Assumptions & cost of capital
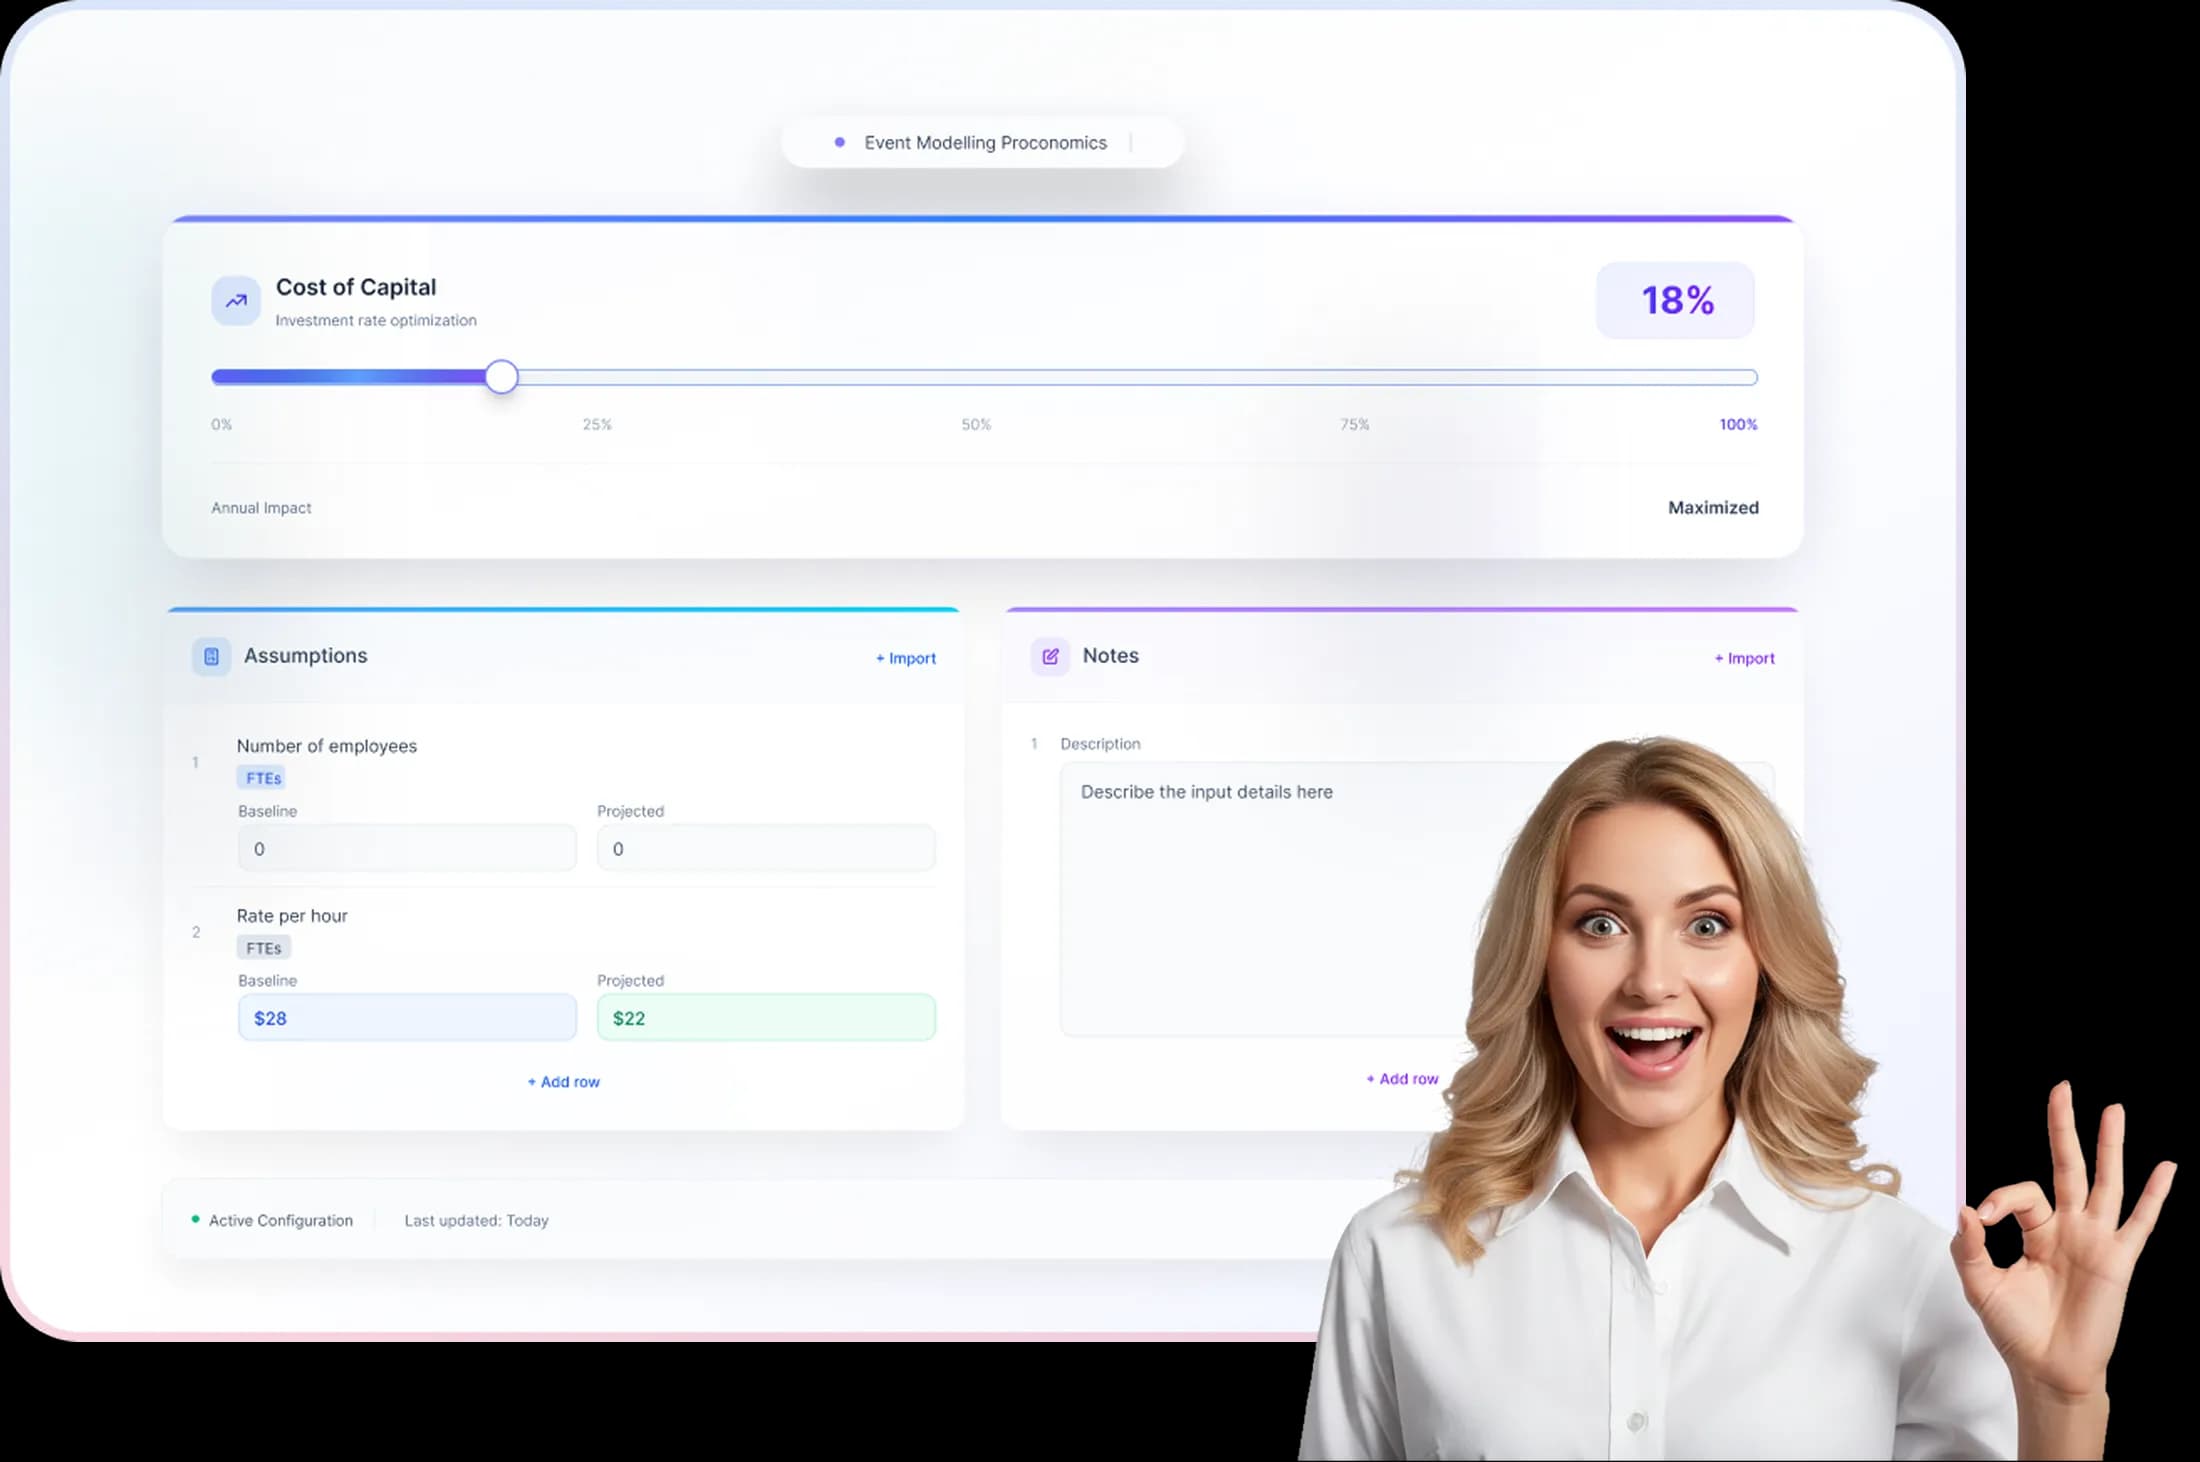
Assumptions that drive the math
Cost of capital, discount rate, and every other driver sits in one page, so the model’s logic is never buried inside a formula.
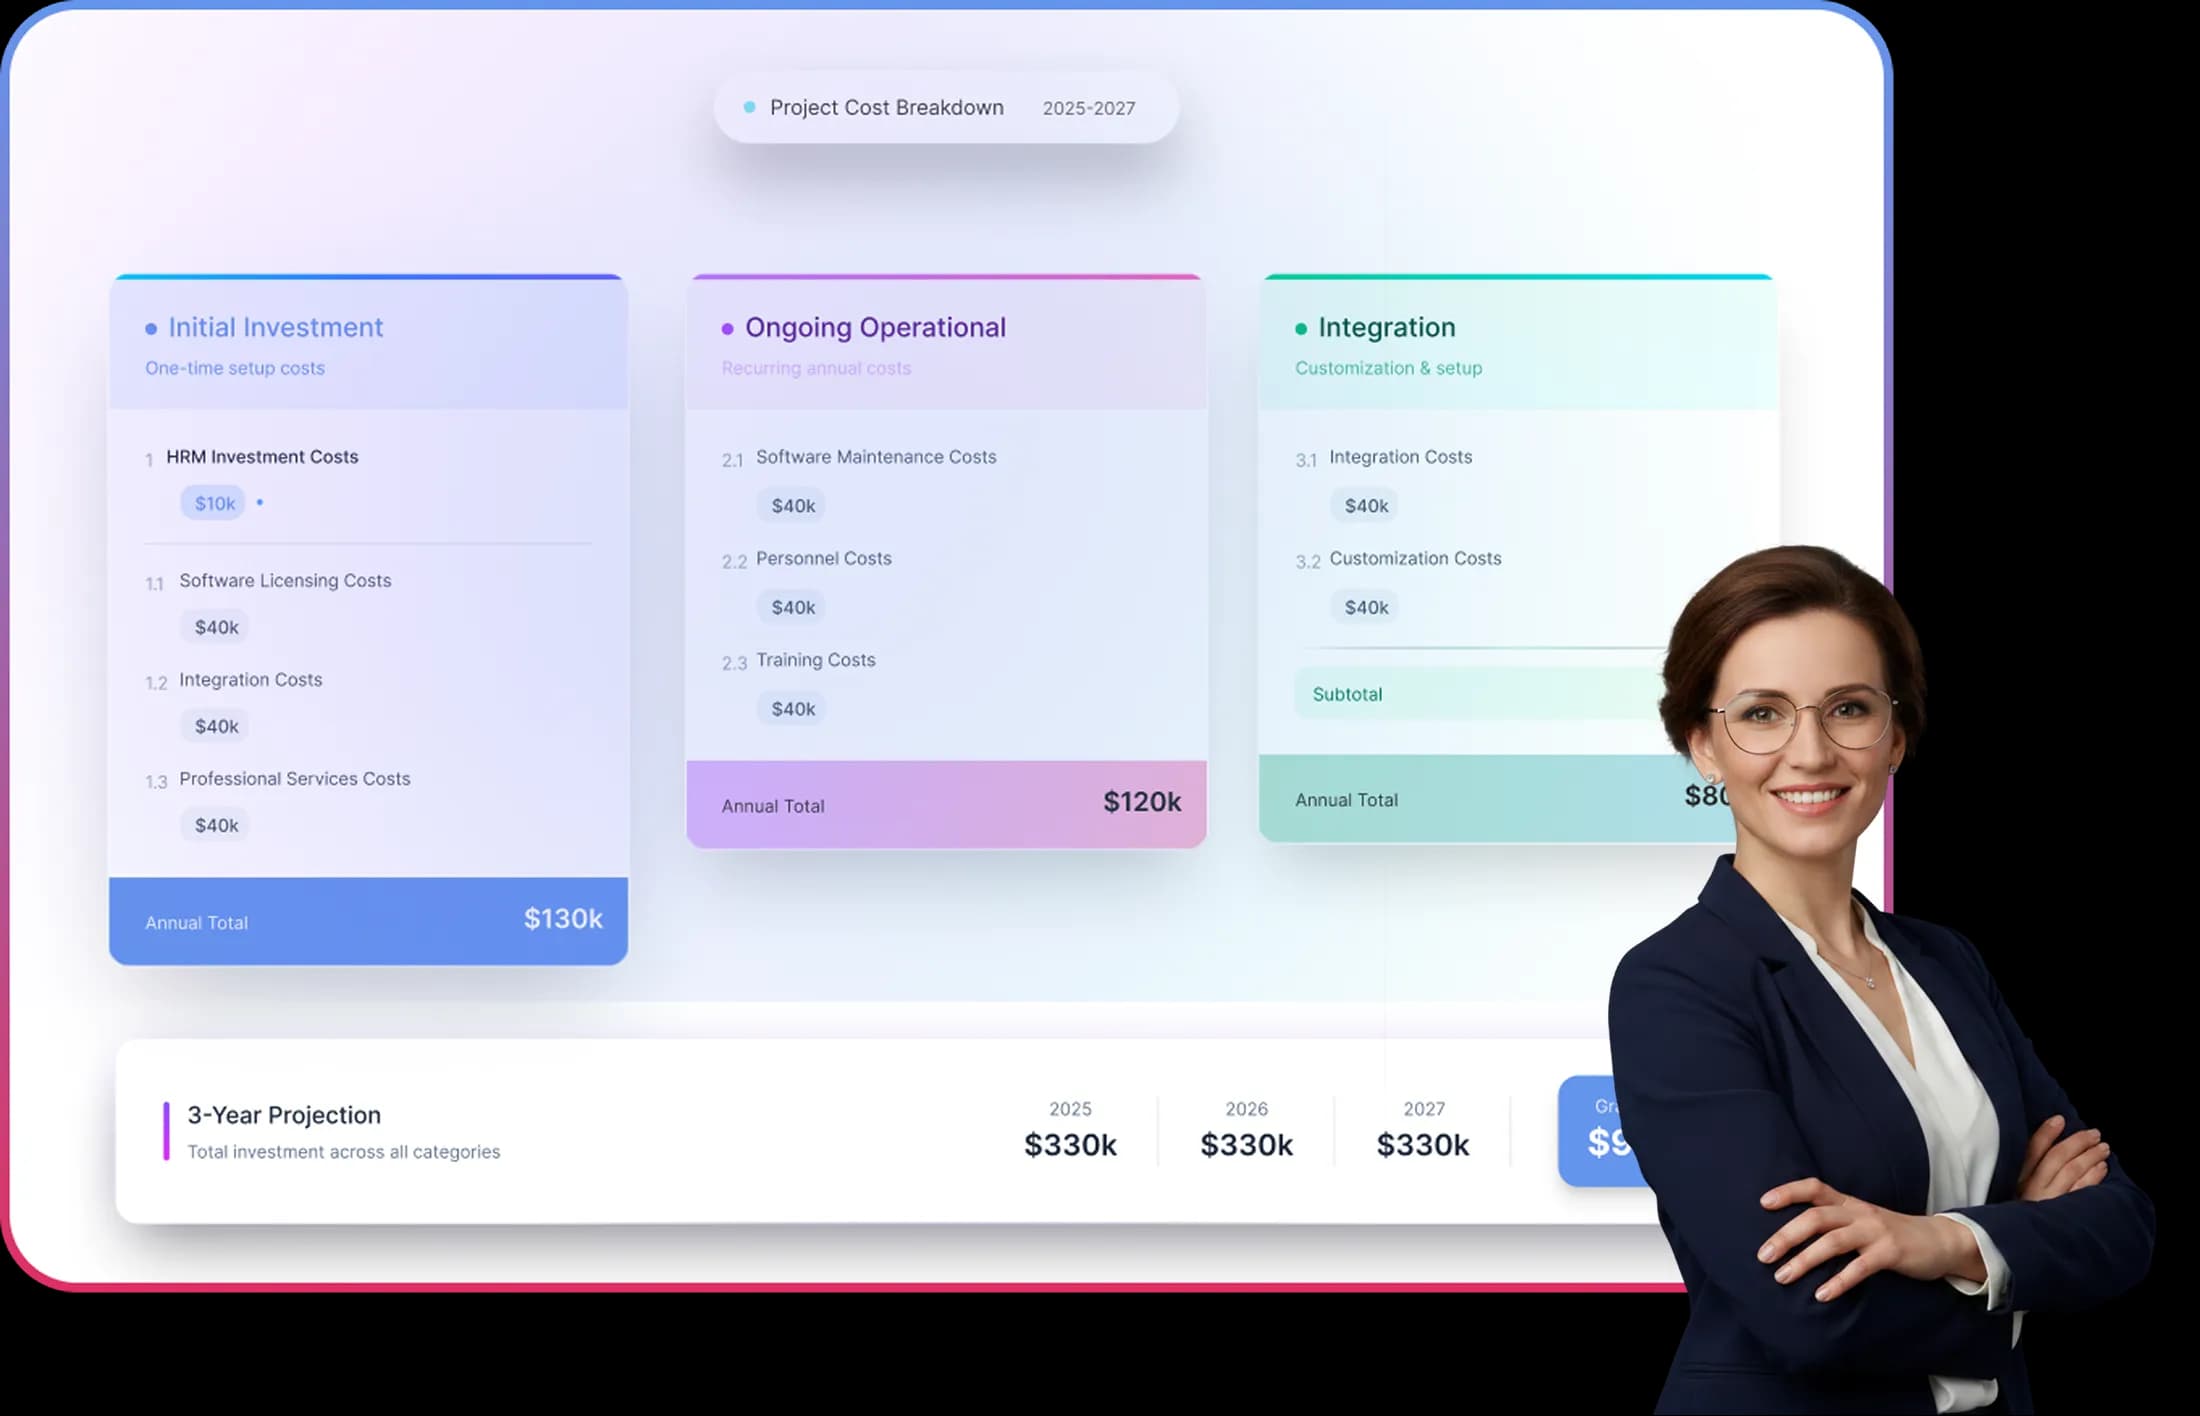
03 · Cost table
Every cost line, by quarter or by year
Set the horizon that fits the project, and view it in quarters or years without building a second version.
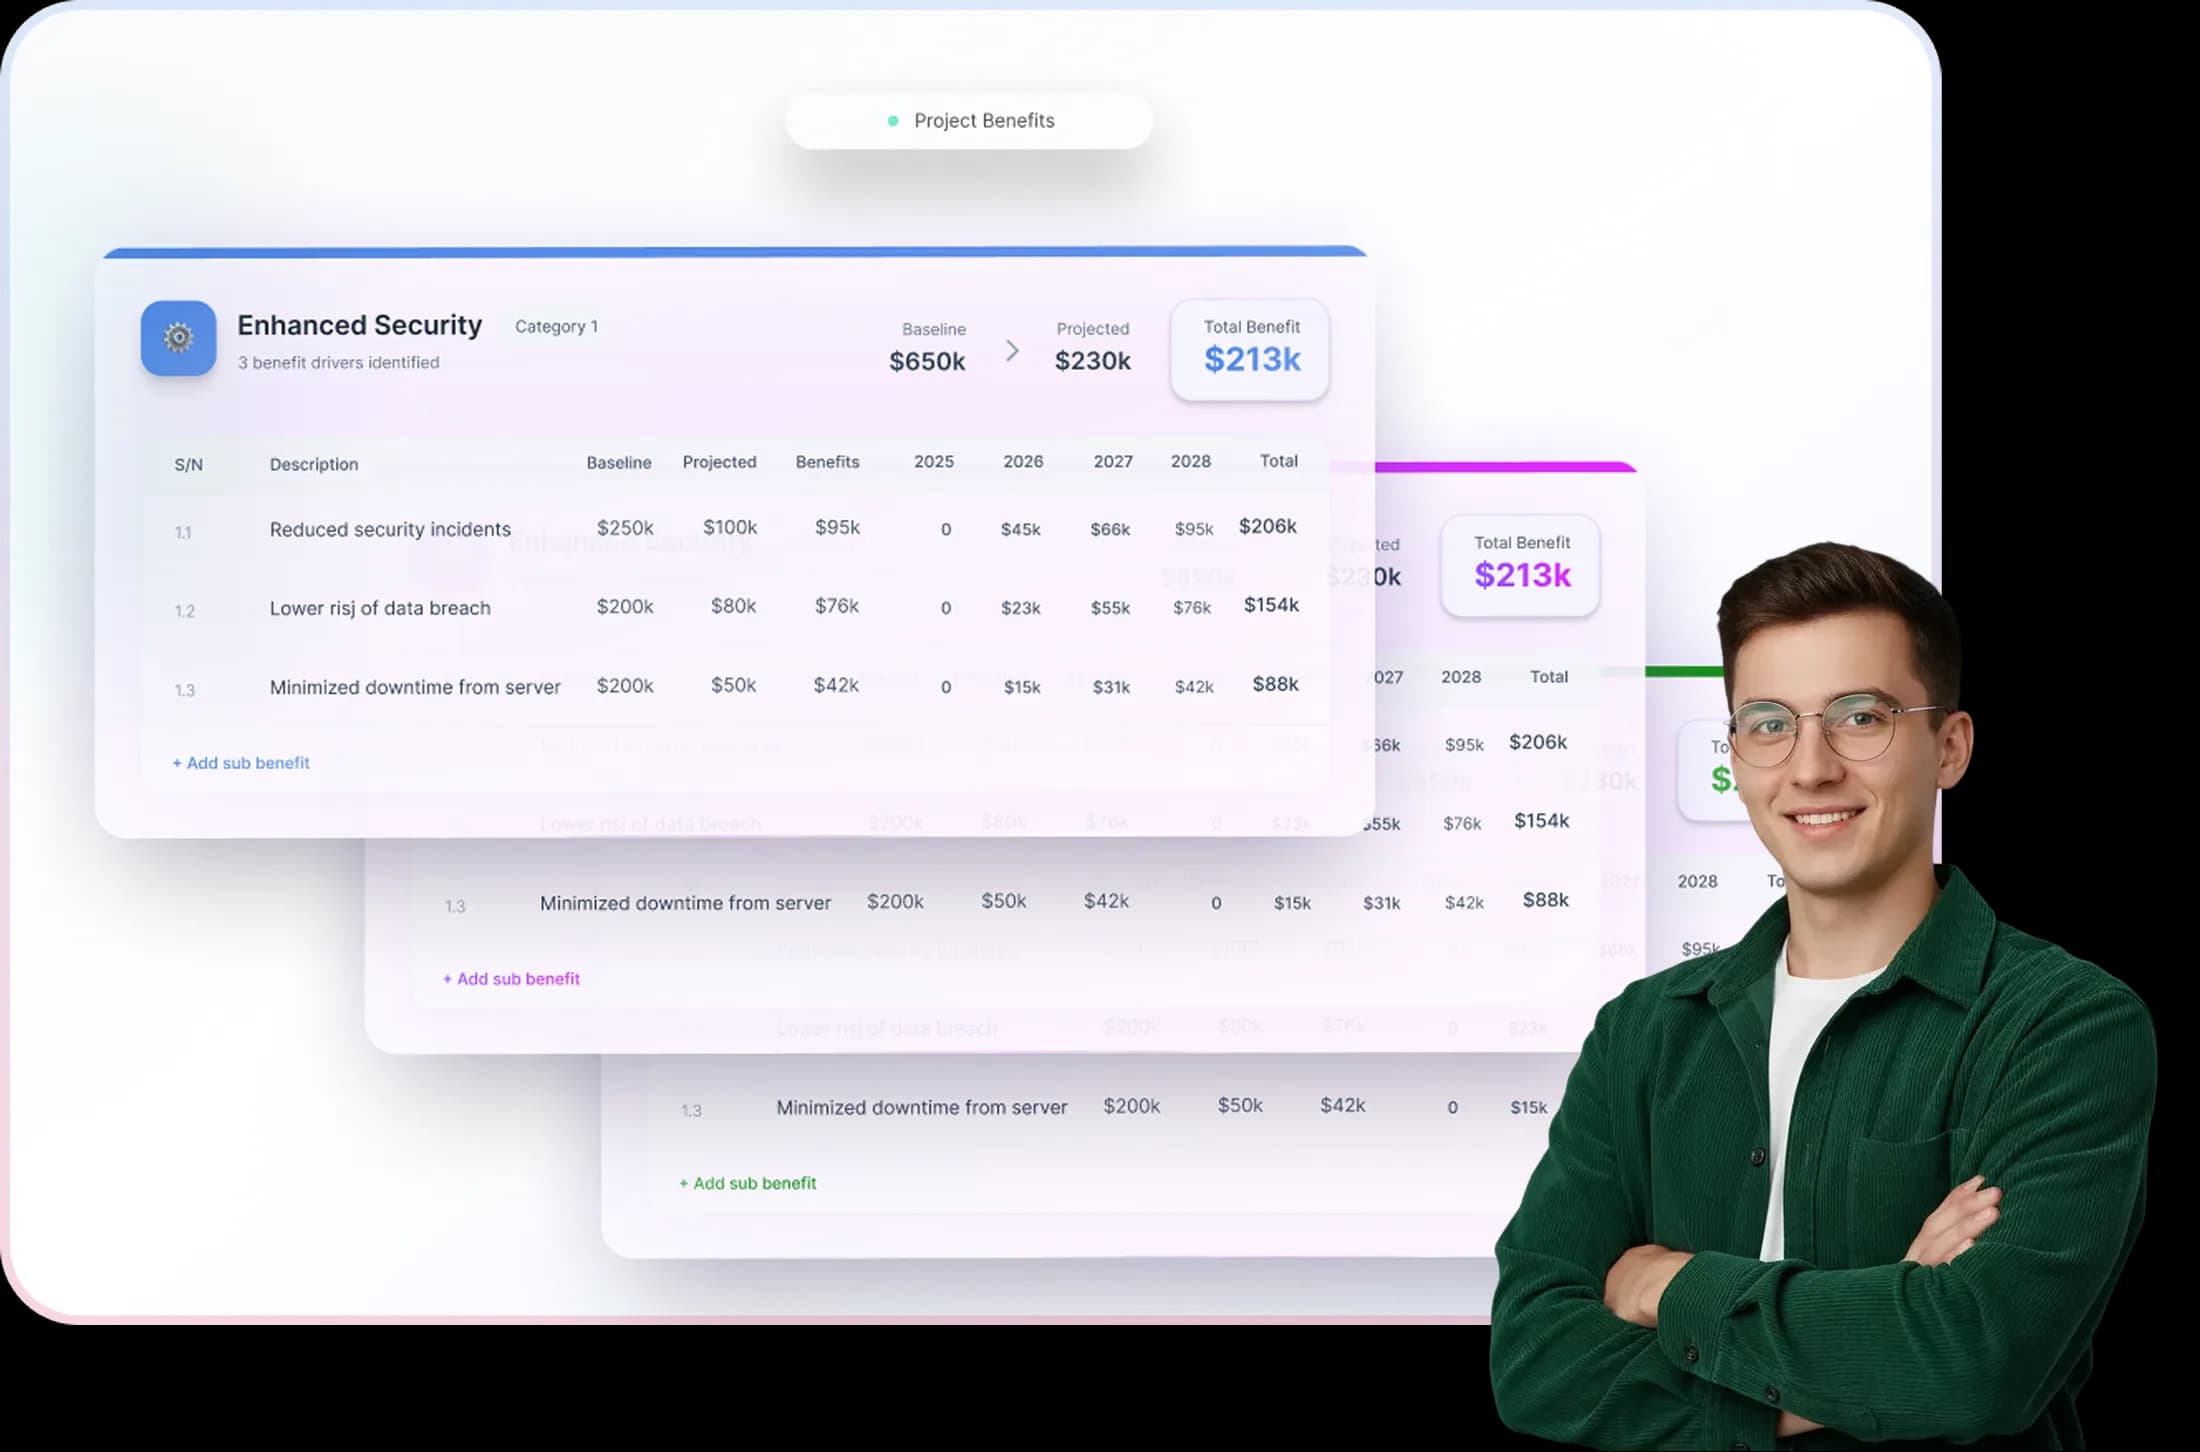
04 · Benefit table
A realization schedule you control
Adjust how each benefit area and type ramps up over the model’s life. Nothing has to realize evenly, and nothing has to realize from day one.
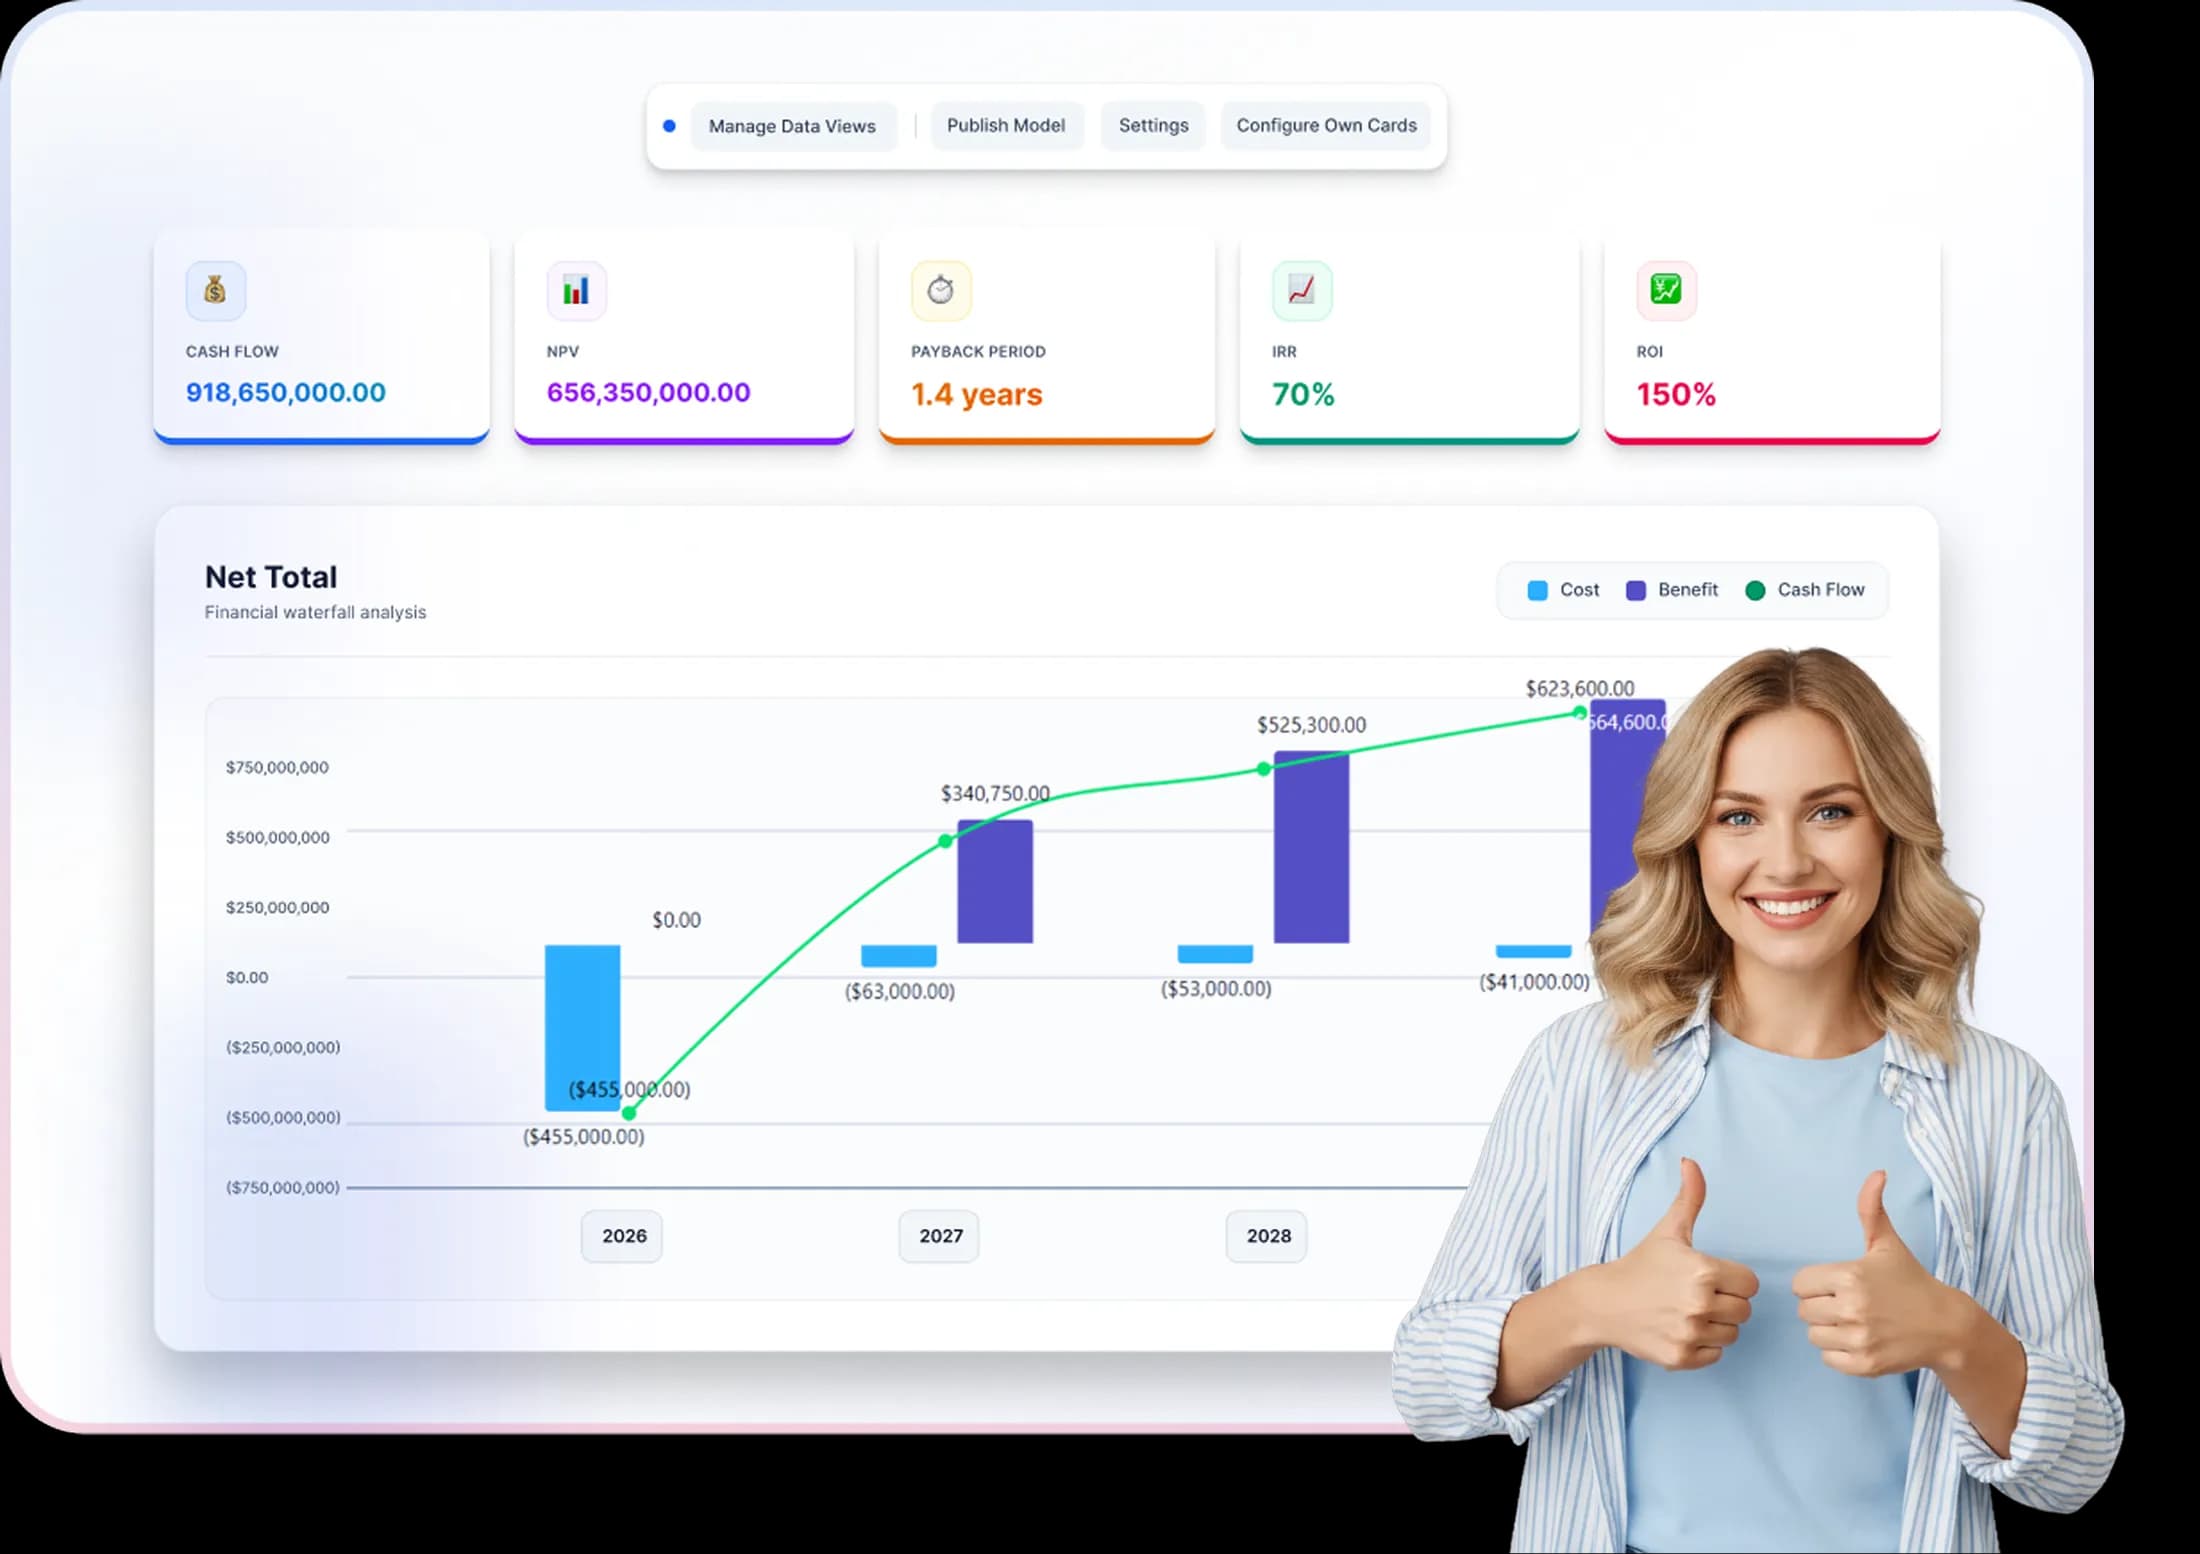
05 · Dashboard
Up to three scenarios, side by side
Model base, upside, and downside cases in parallel, and compare them as a table or side by side on the dashboard.
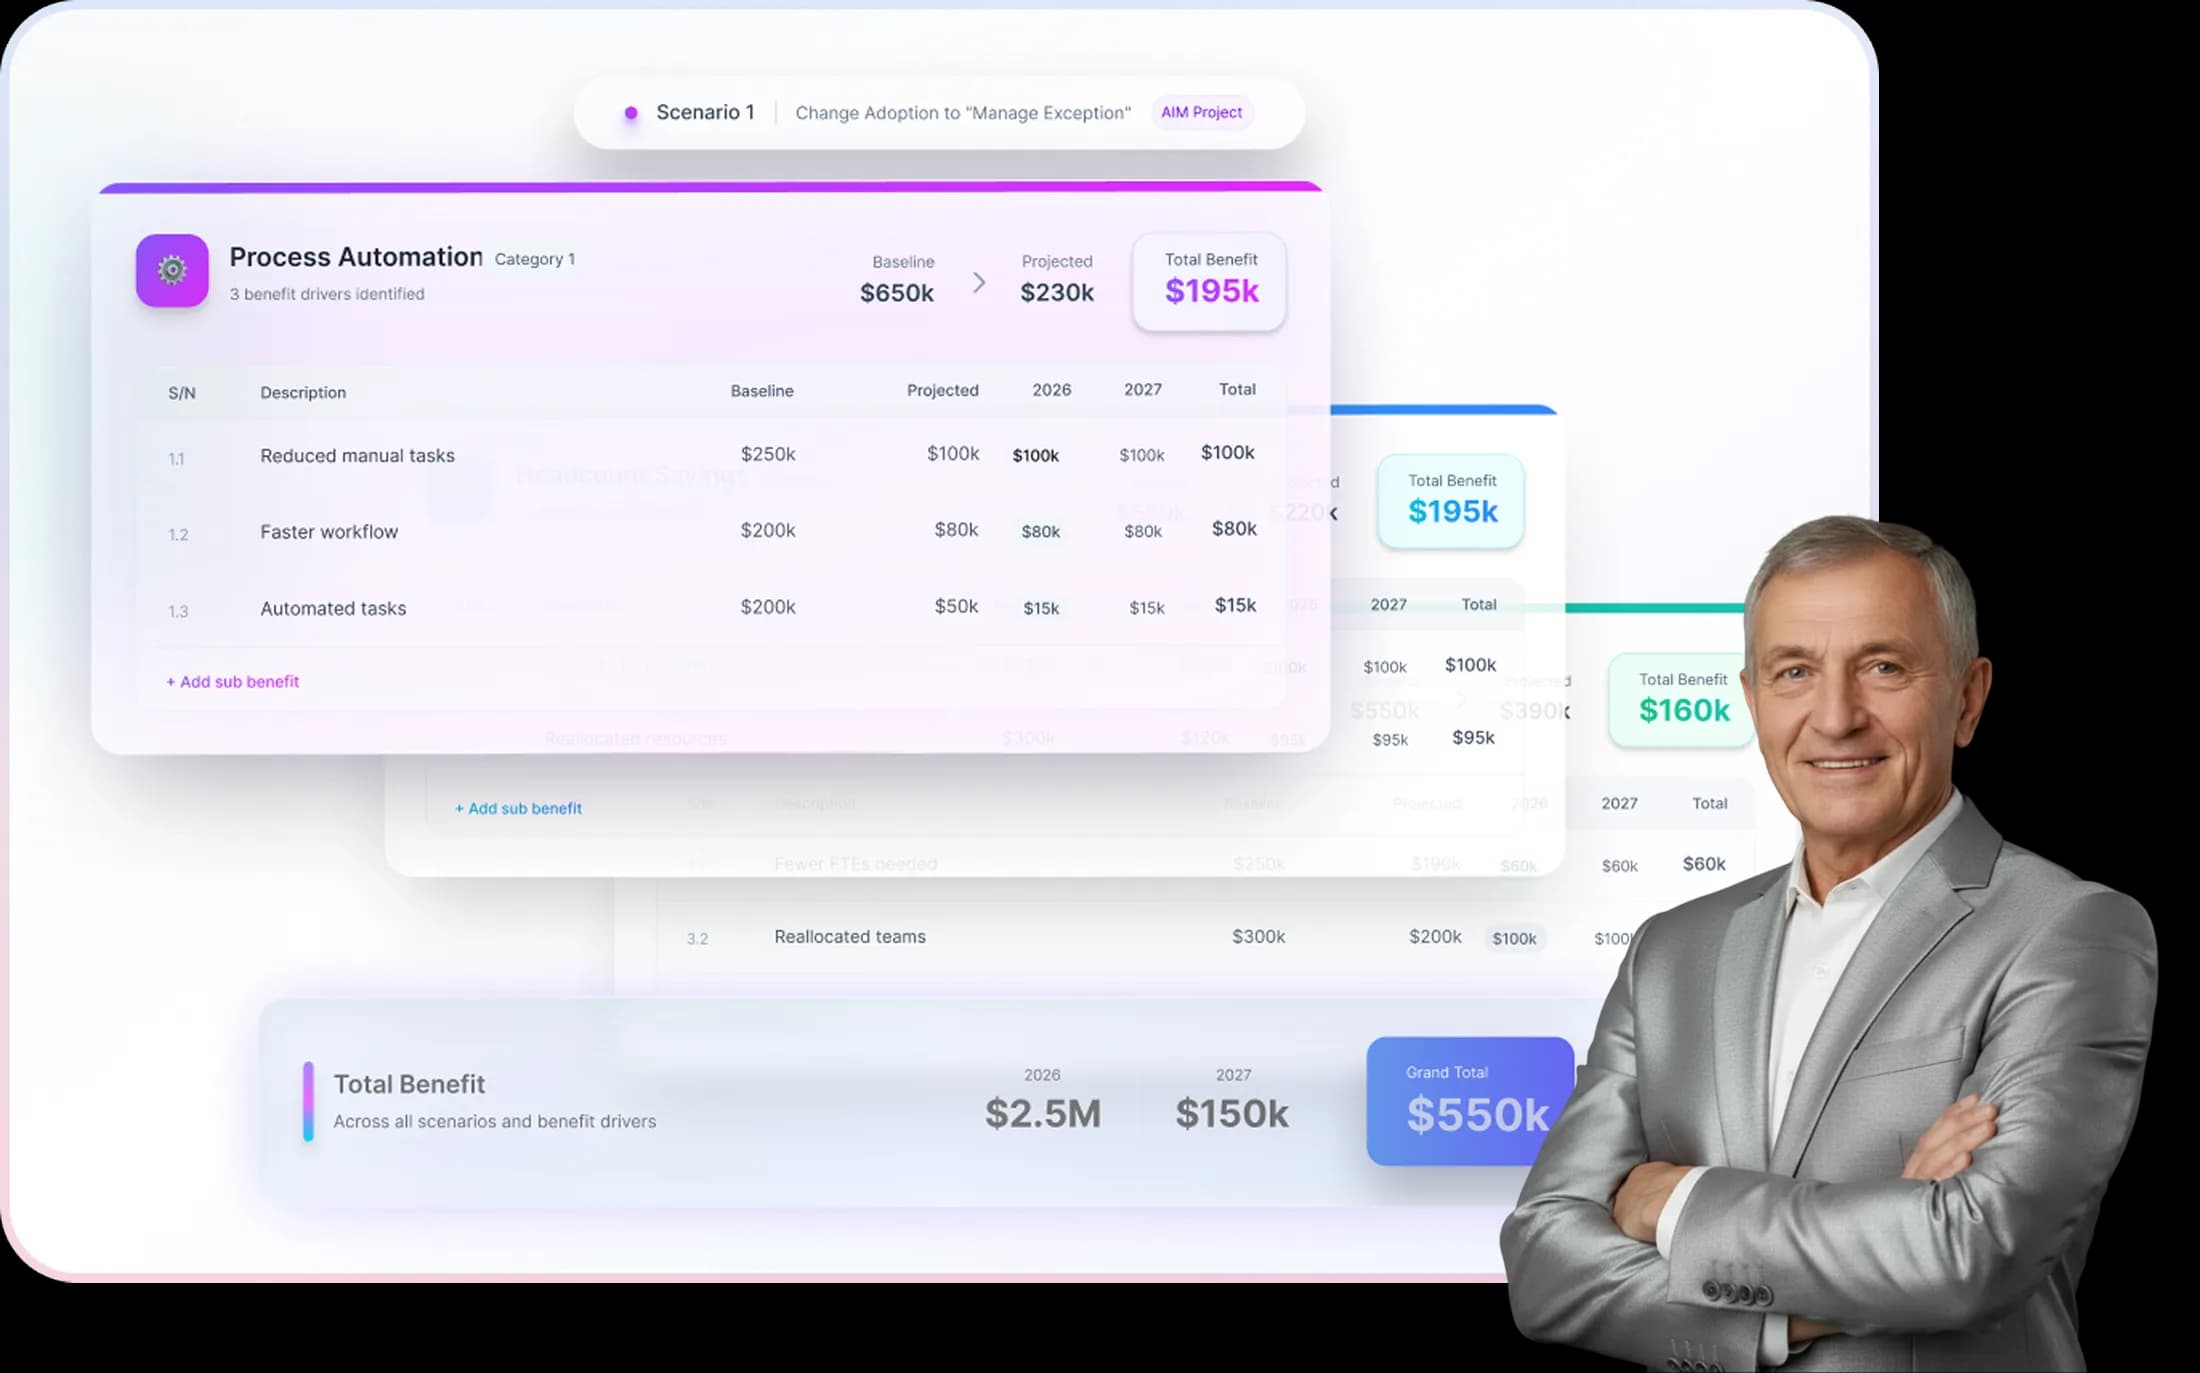
06 · Scenario
Stop Presenting One Number. Start Presenting the Full Range.
Walk into the board room with confidence. Build and compare multiple scenarios; best case, worst case, and most likely directly within the model. Toggle macro-variables like churn rate, cost of capital, or market adoption, and watch the real-time impact on NPV, IRR, and payback.
Five connected pages, every time
A qualitative summary, assumptions with cost of capital, a cost table, a benefit table, and a dashboard, all generated together, whether you start from AI, a template, or a blank page.
01 · Qualitative summary
A story written in plain language
Read the qualitative summary for the narrative, then the dashboard for the numbers. View them in quarters or years, whichever matches how you think about the project.
Templates
200+ industry templates
Start from a template built for your industry and project type instead of a blank spreadsheet, then adjust it to fit.
- Data platform
- Clinical systems
- Fleet electrification
- Branch consolidation
- Digital Ops
- Warehouse automation
- ERP migration
- Cloud migration
- Cybersecurity uplift
- Process automation
- Customer portal
- Network refresh
- Solar retrofit
- Shared services
- Plant modernization
- CRM rollout
The assumptions most templates hide, out in the open.
A business case lives or dies on a handful of judgment calls. Model Builder puts them where everyone can see and challenge them. Try it by moving the levers below.
Cost of capital, set once
10.1%Discount rate and cost of capital sit on the assumptions page, applied consistently to every cost and benefit line in the model.
Realization, not a straight line
Set a realization curve per benefit area and type, whether ramping up, delayed, or front-loaded, instead of assuming every benefit lands evenly.
Scenarios, not a single guess
Base, upside, and downside cases share the same structure, so comparing them is a table lookup, not three separate spreadsheets.
Live result · school build, 5 yrs
Value-creatingNet present value
$27.13M
IRR
86.0%
Payback
1.9 yrs
Total benefit
$53.98M
Net cash flow by year
From blank page to reviewable model
The same four stages, whether the model started with AI or from scratch.
- 01
Start
Describe the project to AI, pick from 200+ templates, or start blank.
- 02
Set assumptions
Cost of capital, cost table, and benefit table, drafted or entered directly.
- 03
Shape realization & scenarios
Adjust the realization schedule per benefit, then build up to three scenarios.
- 04
Review
Read the dashboard or the scenario tables, by quarter or by year.
Built for everyone who touches a model before it’s approved
An analyst, a finance partner, and a sponsor read the same model very differently.
From a blank page to a draft
in minutes
Start from a template close to the project, or describe it to AI and get a structured first pass, then spend your time refining, not formatting.
- ✓200+ templates by industry and project type
- ✓AI-drafted assumptions, costs, and benefits to start from
- ✓Up to three scenarios without duplicating the model
The details you’d check before switching from Anaplan or Planview
A faster way to build a model only matters if it also fits how your organization actually governs, shares, and exports its work.
Platform handoff
Hands off to Value Tracker automatically
Once a model is approved, it becomes the budget baseline in Value Tracker, with no re-keying of costs, benefits, or assumptions.
Model Builder
Approved
Value Tracker
Budget baseline

See what Model Builder is delivering for finance leaders.
We used to spend two weeks building a business case. Now we have a submission-ready model in under a day with scenario comparisons the CFO actually engages with instead of just approving blindly.

Jerry Paul
Finance Director, Enterprise Technology Company
The assumption documentation alone has saved us from three bad investment decisions. When assumptions are explicit, the conversation changes from 'is this number right?' to 'is this assumption reasonable?'

Jimmy Walker
VP of Finance, Global Professional Services Firm
No. AI drafts a starting structure from a project description or template, covering assumptions, costs, benefits, and a qualitative summary. An analyst still reviews, challenges, and refines every number before it goes to approval.
Each model can hold up to three scenarios, typically base, upside, and downside. They share the same structure, so you change only the drivers that differ and compare the results as a table or side by side on the dashboard.
Templates are organized by industry and project type, from ERP migrations to fleet electrification. Each one comes with a qualitative summary, typical assumptions, and pre-structured cost and benefit lines you can adjust to fit the project.
Yes. The time view is a display setting, not a separate model. Flip between quarters and years at any point without rebuilding or re-entering anything.
Questions worth asking before you roll this out
Still have questions?
Can’t find the answer you are looking for? Kindly check our complete list of FAQs.
View Complete FAQsStop maintaining the spreadsheet. Start building the case.
Pick a template, describe the project to AI, or start from a blank model. Assumptions, scenarios, and a dashboard are ready before your coffee is.
No credit card required
Stay ahead of the curve
Subscribe to our newsletter to receive valuable insights directly in your email.
Solutions


