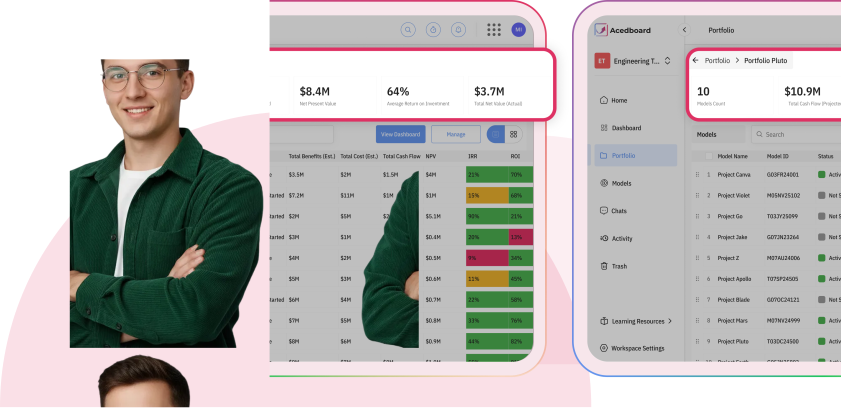
Build the case. Prove the value. Fund what works.

Proconomics uses AI to build the business case, track it against reality, and govern the whole portfolio so every approved project has to answer for the value it promised.

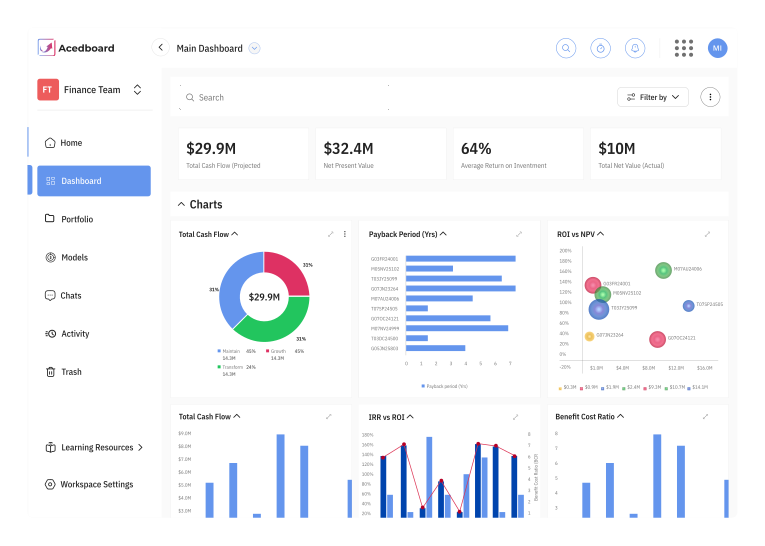
Proconomics main dashboard with cash flow, NPV, payback and IRR charts
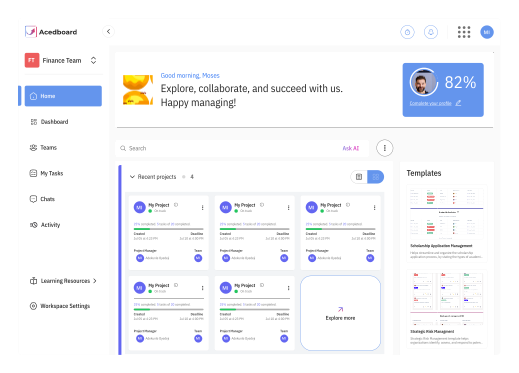
Proconomics home screen with recent projects and templates
The problem

Approval day

Your projects get approved.

Every quarter, leaders approve millions in project spend — and some questions never get answered.

Promised vs. delivered value

Month 2 · 89% of promised value

Promised valueValue gap
Why it matters

Project value gets lost in three places.

Before approval, after approval, and across the portfolio. Most teams patch each one with a different spreadsheet. Proconomics gives each one a dedicated tool, and all of them share one record.

01

Before approval

Five tabs named “FINAL.”

A discount rate that’s different in two of them. No record of who changed the benefit ramp two weeks before the steering meeting.

02

After approval

Three numbers get confused, and efficiencies disappear in a footnote.

An estimate isn’t a budget, and a budget isn’t an actual. And Hours Saved isn’t a soft benefit when it has its own record, annualized value, and qualitative impact.

03

Across the portfolio

Ranking is easy. Defending bucket balance is hard.

Grow quietly cannibalizes Transform, Maintain takes 50%, and capacity issues surface at execution instead of before you prioritize.

One connected investment lifecycle

From the first assumption to the final outcome.

The approved model does not disappear into a file. It becomes the baseline for actuals, forecasts, realized benefits, and portfolio decisions, with context and accountability carried forward at every step.

  1. 01

    Model

    Make the investment case

    Define assumptions, costs, benefits, scenarios, NPV, IRR, and payback manually or with AI assistance.

  2. 02

    Approve

    Create the baseline

    Keep the assumptions, review trail, and approved budget together so everyone knows what the project promised.

  3. 03

    Track

    Compare promise to reality

    Reconcile ERP actuals, EAC, financial value, efficiencies, and qualitative outcomes against the approved case.

  4. 04

    Allocate

    Fund the best portfolio

    Balance Transform, Maintain, and Grow, test scenarios, check capacity, and preserve every decision in the governance log.

One source of truth, not three disconnected handoffs

Model Builder feeds Value Tracker. Value Tracker feeds Portfolio. Decisions stay traceable back to the case.

Explore the tools
The tools

Three tools today. One platform that keeps growing.

Start with the tool that fits the problem in front of you. Each one works on its own and hands off to the next automatically, so nothing gets re-keyed as a project moves from case to portfolio.

01 — Model BuilderLive

Build the case

Build the model. Manually, or just describe it.

Turns a project description — or a template, or a blank page — into a complete business case: assumptions, cost of capital, cost and benefit tables, a realization schedule, and up to three scenarios, ready to view by quarter or by year.

Explore Model Builder
  • 200+ industry templates, or let AI draft the first pass
  • Cost of capital set once, applied everywhere
  • Up to three scenarios, compared side by side
  • A realization curve per benefit: ramping up, delayed, or front-loaded
  • Every change logged automatically
01 Summary02 Assumptions03 Costs04 Benefits05 Dashboard

Warehouse automation · 5 yrs

NPV

$2.95M

IRR

61.4%

Payback

2.0 yrs

Total benefit

$6.2M

Net cash flow by year ($M)

0.33
0.89
1.29
1.45
1.45
-1.20Y0
Y1
Y2
Y3
Y4
Y5
200+
ready-made templates
3
scenarios per model
3 / 5 / 10
year horizons
02 — Value TrackerLive

Prove what was delivered

Prove the business case didn’t stop at approval.

Shows what was actually delivered, including financial returns and non-financial efficiencies like Hours Saved, with actuals pulled directly from your ERP and a latest summary generated by AI, so you walk into steering with the answer, not a spreadsheet.

Explore Value Tracker
  • Estimate, budget, and actuals reconciled on every cost and benefit line
  • EAC calculated on standard EVM logic
  • An NPV bridge from baseline to EAC, always current
  • Hours Saved, FTE capacity, and cycle time tracked as first-class records
  • Alerts the moment forecast drift crosses your threshold

Network modernization · Reconciliation

Actuals from SAP

Cost lineEstimateBudgetActual
Hardware$6.2M$5.4M$3.9M
Licences$4.1M$3.6M$2.2M
Integration services$7.3M$6.4M$4.1M
Change management$3.4M$3.0M$1.0M
Total$21.0M$18.4M$11.2M

Actuals $11.2M + Forecast remaining $9.3M = EAC $20.5M

+$2.1M · +11.4% · alert sent
3
definitions reconciled on one line
100%
of edits logged with who, when, and why
1
bridge chart, ready for steering
03 — PortfolioLive

Govern the portfolio

Defend why this portfolio, not that one, in 10 minutes.

See your portfolio by Transform, Maintain, Grow. Map to OKRs, pull budget actuals from Value Tracker, run what-if optimization across workspace candidates, and keep every decision auditable with versioning.

Explore Portfolio
  • Transform / Maintain / Grow buckets mapped to OKRs
  • Ranked by NPV per $, on the budget finance already approved
  • An optimization sandbox: nothing changes until you Apply
  • Decision log, versioning, appeal window, and a board approval gate

Bucket balance · target vs actual

v1 · Before optimization
Transform45% · target 50% · below
Grow35% · target 30%
Maintain20% · target 20%

Ranked by NPV per $

  1. 1Atlas ERPTransform$1.85M
  2. 2Coral HealthCandidateTransform$1.85M
  3. 3Beacon CloudGrow$1.42M
  4. 4Andes LogisticsMaintain$0.92M
3
strategic buckets, target vs actual
NPV per $
ranking on approved budget
100%
mapped to OKRs
Run optimization • Workspace candidates

Sandbox until you Apply. Budget from Value Tracker, capacity from Resource Management.

Mode 1 Portfolio Only / Mode 2 Portfolio + Workspace candidates (Coral Health etc). Optimizer ranks by NPV per $ with budget from Value Tracker and capacity from Resource Management. Impact +$1.6M NPV −400 hrs. On Apply: Portfolio Overview becomes v2, removed becomes Unfunded / Out Reason Optimization.

Two modes: Portfolio Only (re-balance existing) vs Portfolio + Workspace (include candidates like Coral Health [Transform]).

Constraints: Budget from Value Tracker, capacity from Resource Management, bucket targets (Transform 50%). Optimizer respects all three.

What-if without risk: Sandbox until Apply. Save as Scenario, compare v1 vs v2, then Apply to become Portfolio Overview v2.

Optimization Sandbox

Sandbox · not applied
Click to include or exclude
Budget from Value Tracker$15.3M
Capacity from Resource ManagementEngineering 1,600h

NPV Impact

±$0.0M

$11.2M → $11.2M

Capacity

±0 hrs Eng

Bucket shift

Transform 45%→45%

Budget from VT

±$0.0M variance

$15.0M of $15.3M

Engineering over capacity by 260h

Transform 45%, below 50% target

Projects to Add • Included

None

Projects to Remove • Out Reason

None

On Apply: Portfolio Overview becomes v2 • Removed → Unfunded • Decision logged

Built on AI, not bolted on

AI accelerates the analysis. People own the decision.

Use AI to draft models, challenge assumptions, explain variance, and prepare current summaries from the data already in the case. Portfolio decisions remain governed, versioned, and accountable to people. Pick an example to see it work.

01 · Model Builder

Describe the project. Get a drafted model.

In Model Builder, describe a project in plain language and AI drafts the qualitative summary, assumptions, cost of capital, and cost and benefit tables — ready for an analyst to review and refine.

A 5-year cloud migration for a 2,000-person retailer…

Generate
  • Qualitative summary
  • Assumptions
  • Cost of capital
  • Cost and benefit tables

Ready for an analyst to review and refine

Why Proconomics

Not another spreadsheet. Not another dashboard.

Most tools help you plan, track tasks, or visualize data. Proconomics connects the financial model to real execution, so you can prove the value a project actually delivered.

From projections to proof

Spreadsheets are fine for building a forecast, but they stop at assumptions. Proconomics carries the model through execution, so you can track actual outcomes against it.

From projections to proof: a Proconomics portfolio view
Enterprise-grade security

Your financial data deserves the highest level of protection

Built to meet the security and compliance bar of enterprise procurement — not just stated, but independently verified.

Independently verified

Role-based access

Granular permissions ensure the right people see the right data, nothing more.

SOC 2 Type II certified

Independently audited controls for security, availability, and data integrity.

GDPR & data residency

Full compliance for global organizations with data sovereignty requirements.

256-bit encryption

Your financial models and portfolio data, encrypted end to end.

Built for real-world use cases

From telecom and healthcare to enterprise IT and finance, Proconomics provides structured templates that reflect how different industries define and track value.

Try Now
CEM Systems Implementation
Cloud Computing and Virtualization
Business Intelligence System Development
image of human point to templates
Integrations

Plugs into the Tools Your Team Already Uses.

No rip-and-replace. Proconomics connects to your existing ecosystem so data flows automatically and your team gets value from day one.

SlackGoogle DriveJiraSlackGoogle DriveJiraSlackGoogle DriveJiraSlackGoogle DriveJiraSlackGoogle DriveJiraSlackGoogle DriveJiraSlackGoogle DriveJiraSlackGoogle DriveJira
JiraGoogle DriveSlackJiraGoogle DriveSlackJiraGoogle DriveSlackJiraGoogle DriveSlackJiraGoogle DriveSlackJiraGoogle DriveSlackJiraGoogle DriveSlackJiraGoogle DriveSlack

Different roles.

One source of financial truth.

Proconomics serves every stakeholder who touches a project investment.

CFO & Executive Team

Real-time portfolio ROI. Consolidated variance reporting. Financial clarity to make confident funding decisions - without waiting for a quarterly report.

Portfolio Directors & PMOS

Track every project against its approved business case. Surface underperformers early. Own portfolio governance with data, not instinct.

Finance Analysts

Structured templates. Scenario modeling. Assumption documentation. Everything to build credible business cases and track performance after approval.

Testimonials

See what Proconomics is delivering for finance leaders.

Before Proconomics, our business cases lived in slides and died after approval. Now every project has a live financial model we revisit every quarter. Our CFO references Proconomics data in board meetings.

Matthew Collins

Matthew Collins

VP of Finance, Fortune 500 Financial Services Firm

The ability to import our trusted Excel models and immediately see them interact with real-world execution was a game-changer. We finally have a single source of truth that captures both financial gains and non-financial wins like efficiency. It has completely elevated how we report project health to executive leadership.

Michael Thompson

Michael Thompson

Portfolio Director, Enterprise Healthcare

An AI-powered platform that connects business case modeling, real-time value tracking, and portfolio governance in one place — so project value can be proven, not just projected.

Excel is good at building a projection. Proconomics keeps that projection alive after approval: the approved model becomes the baseline, actuals arrive from your ERP, and every gap between promise and reality is tracked, explained, and logged.

For business cases, value tracking, and portfolio decisions, yes. You can still import trusted Excel models to start from, and keep Excel, Google Sheets, and Power BI in the loop through the built-in integrations.

No. AI drafts the first pass, checks assumptions, and summarizes what changed. The analyst reviews and refines the model, and portfolio decisions stay governed, versioned, and owned by people.

Yes. Value Tracker pulls actuals from SAP, Oracle, Workday, or Dynamics, so estimate, budget, and actual are reconciled on every cost and benefit line without anyone re-keying numbers.

Projects are grouped into Transform, Maintain, and Grow, each mapped to an OKR. Portfolio shows allocation against target, ranks projects by NPV per dollar, and flags the moment bucket balance drifts.

Describe the project in plain language and Model Builder drafts the qualitative summary, assumptions, cost of capital, and cost and benefit tables. It can also review a finished model for inconsistencies before you present it.

FAQs

Questions worth asking before you roll this out

Still have questions?

Can’t find the answer you are looking for? Kindly check our complete list of FAQs

View Complete FAQs

Connect every investment decision, from first assumption to realized value.

Build stronger cases, catch value drift earlier, and direct capital toward the portfolio your strategy actually needs.

No credit card required · SOC 2 Type II · Connects to Model Builder

Stay ahead of the curve

Subscribe to our newsletter to receive valuable insights directly in your email.


Proconomics
LinkedIn iconTwitter iconFacebook iconInstagram icon